KTAU Perturbation Results
The Nas Parallel Benchmarks (NPB 2.3) LU application (Class W) was run on a 4-processor SMP i386 box running Linux 2.4 OS. An experiment consisted of running the LU application 10 times (each called a run) and recording the Total Execution time (as reported by LU) for each run.
Three different experiments were run, each under a different OS-environment. The first experiment (titled vanilla-2.4.30) was run under a vanilla Linux kernel version 2.4.30. The second experiment (titled Profiled-2.4.30) was run under a modified Linux kernel version 2.4.30. The Profiled-2.4.30 kernel was patched with KTAU. It was configured with all instrumentation points but with only Profiling support. The last experiment (titled Prof/Trace-2.4.30) was run under a modified kernel similar to the previous. But this KTAU patched kernel had Tracing support, in addition to Profiling, turned on.
Figure 1 shows the results of the three experiments as Cumulative Density Functions (CDF) of the Total Execution time. This way of portraying the results provides more detail (versus just showing the minimum values for the different experiments).
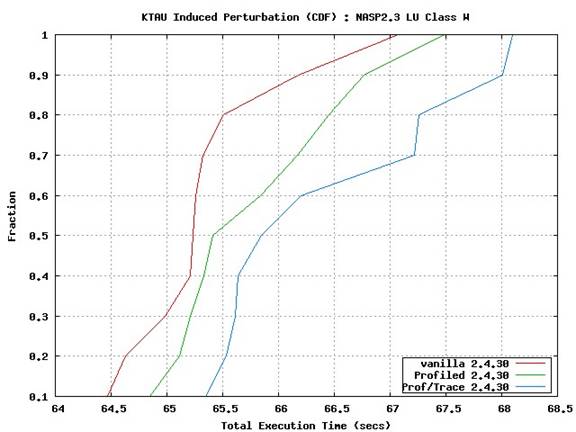
Figure 1
As can be seen from Figure 1, at the minimum execution times recorded for each experiment, the perturbation induced (as seen in dilation of execution time) by only KTAU-profiling is approximately 0.38 seconds. That is a 0.58% increase. KTAU-profiling + tracing support, not surprisingly, introduces more perturbation of approximately 0.88 seconds, which is a 1.36% increase.
Table 1 (in seconds)
|
|
0th |
50th |
80th |
99th |
|
Vanilla 2.4.30 |
64.47 |
65.23 |
65.51 |
67.07 |
|
Profiled 2.4.30 |
+0.38 |
+0.18 |
+0.94 |
+0.41 |
|
Prof/Trace 2.4.30 |
+0.88 |
+0.62 |
+1.75 |
+1.03 |
Table 1 shows the execution time dilation at the 0th (minimum), 50th, 80th and 99th percentiles. Table 2 shows the mean and variance of execution time (of the different runs within a single experiment) and the mean dilation (mean execution time of KTAU run mean execution time of vanilla run).
Table 2 (in seconds)
|
|
Mean |
Variance |
% Mean Dilation |
|
Vanilla 2.4.30 |
65.385 |
0.755 |
0 |
|
Profiled 2.4.30 |
65.862 |
0.842 |
0.73 |
|
Prof/Trace 2.4.30 |
66.477 |
1.066 |
1.67 |
As the results show, under KTAU Profiling support with all instrumentation points enabled (including interrupts) the range of perturbation induced is under 1%. When KTAU Tracing is also enabled, perturbation still remains under 1% at the 0th and 50th percentiles and is under 2% even at the 99th percentile.
It must be borne in mind that the above experiments were made in a system which i)did not have high background noise, ii)did not have high background contention for processor or memory and iii)did not have a high interrupt arrival rate. Experiments to observe KTAU perturbation behavior under those conditions are still to be done.