KTAU Perturbation Results - 02
The Linux (2.4.30) Kernel compilation was run on a 4-processor SMP i386 box running Linux 2.4 OS. An experiment consisted of running the compile 10 times (each called a run) and recording i) the User Execution time and ii) the System Execution time (both reported by the time command on Linux) for each run. This individually identifies the user & system contribution to the Total Execution (wall-clock) time.
Three different experiments were run, each under a different OS-environment. The first experiment (titled vanilla-2.4.30) was run under a vanilla Linux kernel version 2.4.30. The second experiment (titled Profiled-2.4.30) was run under a modified Linux kernel version 2.4.30. The Profiled-2.4.30 kernel was patched with KTAU. It was configured with all instrumentation points but with only Profiling support. The last experiment (titled Prof/Trace-2.4.30) was run under a modified kernel similar to the previous. But this KTAU patched kernel had Tracing support, in addition to Profiling, turned on.
Figure 1 shows the results of the three experiments as Cumulative Density Functions (CDF) of the User Execution time.
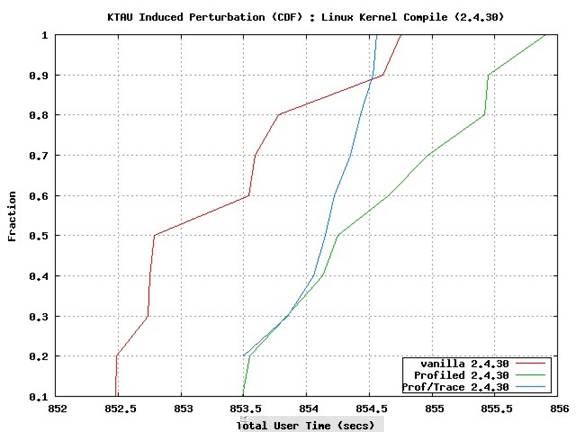
Figure 1 - User Time
As can be seen from Figure 1, the differences between the vanilla and the modified experiments are extremely small between 0.1% and 0.3%. This maybe negligible enough to be considered as noise. This is expected as the times reported in Figure 1 are User-times and KTAU perturbation is at the System level.
Figure 2 shows the results of the three experiments as Cumulative Density Functions (CDF) of the System Execution time (as reported by time command).
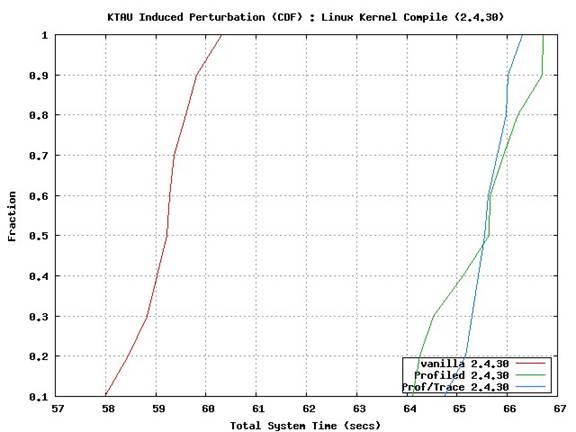
Figure 2 System Time
Significant differences between the vanilla experiment and the modified-OS experiments are pointed out by Figure 2. In particular the KTAU perturbation is shown at approximately 10%-13%. This is two orders of magnitude greater than the perturbation reported by User-times and almost an order of magnitude greater than the perturbation reported by the NPB LU experiment.
The User-time graph is self-explanatory (KTAU perturbation is at system level and user-time excludes the same).
One point to notice is that although the System-time perturbation is over 10%, the overall perturbation (as seen in total wall-clock time) still hovers around 1%-2%. This is because the System-time is only a small portion of the Total Execution time (which is dominated by User-time). Hence the System-time perturbation gets drowned when performing calculations on Total Execution time. This is the reason the NPB results showed small 1-2% perturbation.
This shows that NPB-LU Class W (and possibly other NPB programs as well) is not a good choice to study perturbation at OS/System level. A workload that is more OS-intensive (i.e. one which uses the services of the OS in plenty) is more appropriate. Another option is to use the time command along with LU to only observe the System-time.
Both of these options are currently being explored. In addition OS-benchmarks like Lmbench (a suite of micro-benchmarks for Linux) are being currently used. Results coming soon.
The time command was the primary source of the above numbers. They are only as accurate as time is.