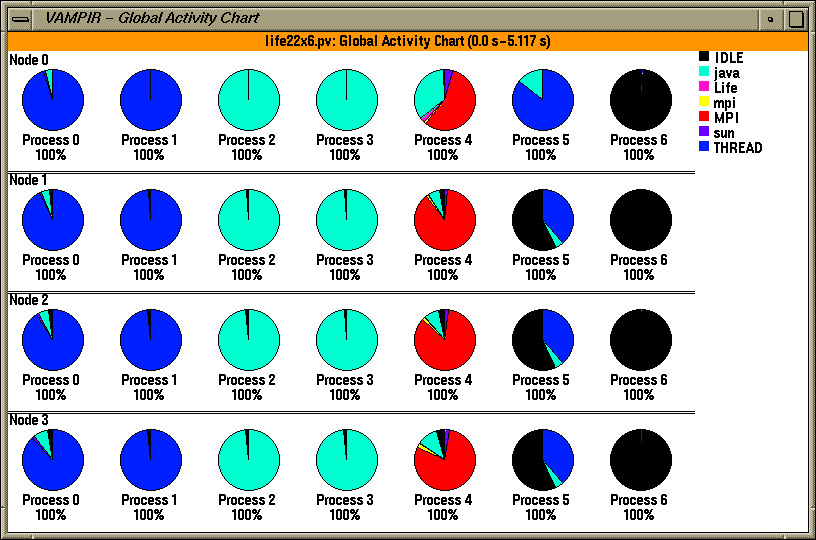
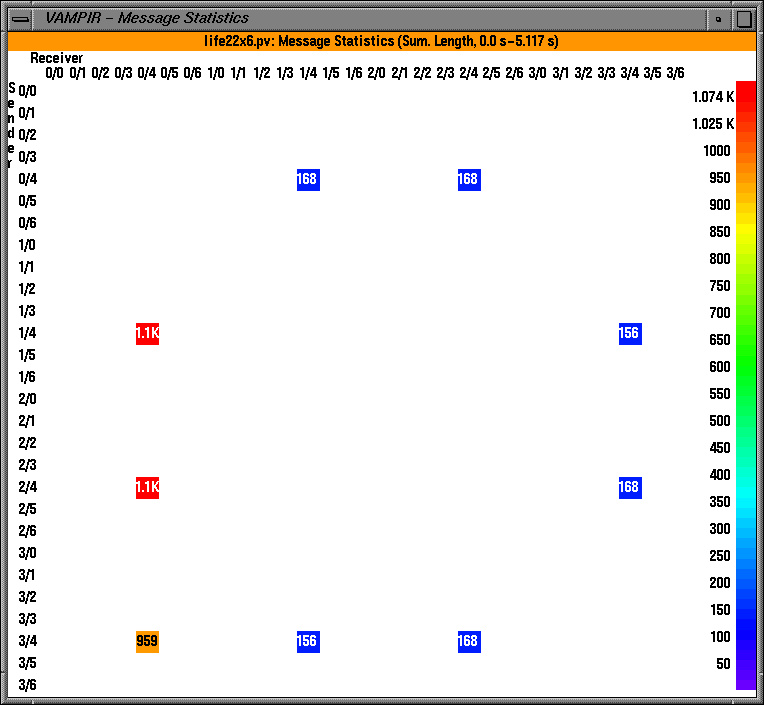
Figure 4. Vampir global activity chart and communication matrix displays illustrate node and thread grouping