S. Shende, A. D. Malony, R. Ansell-Bell, "Instrumentation and Measurement Strategies for Flexible and Portable Empirical Performance Evaluation," Proceedings TTPE, PDPTA'01 June 2001.
Abstract Flexibility and portability are important concerns for productive empirical performance evaluation. We claim that these features are best supported by robust instrumentation and measurement strategies, and their integration. Using the TAU performance system as an exemplar performance toolkit, a case study in performance evaluation is considered. Our goal is both to highlight flexibility and portability requirements and to consider how instrumentation and measurement techniques can address them. The main contribution of the paper is methodological, in its advocation of a guiding principle for tool development and enhancement. Recent advancements in the TAU system are described from this perspective.
Introduction
The evolution of computer systems and of the applications that run on them - towards more sophisticated modes of operation, higher levels of abstraction, and larger scale of execution - challenge the state of technology for empirical performance evaluation. The increasing complexity of parallel and distributed systems, coupled with emerging portable parallel programming methods, demands that empirical performance tools provide robust performance observation capabilities at all levels of a system, while mapping low-level behavior to high-level performance abstractions in a uniform manner. In this paper, we take aim at the first part of these dual goals - robust performance observation - and focus specifically on strategies for flexible and portable performance instrumentation and measurement.
Performance observation requirements will be determined by the characteristics of the performance problem being addressed and the evaluation methodology being applied. In general, one can view these requirements with respect to three instrumentation and measurement axes:
-
Where in the program are performance measurements made (granularity and location) and where is performance instrumentation possible (program and system visibility).
-
When is performance instrumentation done (source-level, compile-time, link-time, runtime) and when are performance measurements enabled.
-
How are performance measurements defined and how are instrumentation alternatives chosen.
Fundamental to this where/when/how perspective is the concept of performance events and their associated performance semantics. Performance events can be common (low-level) events with simple performance semantics, such as routine entry and exit events, message communication events, or threading events, or most abstract (higher-level) events that have more complex semantics, requiring more sophisticated performance observation techniques. Associated with performance events are application-level metrics, such as routine execution time, message size, and synchronization counts, as well as system-specific performance data that might be obtained from hardware performance monitors or OS services.
Given the diversity of performance problems, evaluation methods, and types of events and metrics, the instrumentation and measurement mechanisms needed to support performance observation must be flexible, to give maximum opportunity for configuring performance experiments to meet where/when/how objectives, and portable, to allow consistent cross-platform performance problem solving. In general, flexibility in empirical performance evaluation implies freedom in experiment design, and choices in selection and control of experiment mechanisms. Using tools that otherwise limit the type and structure of performance methods will restrict evaluation scope. Portability, on the other hand, looks for common abstractions in performance methods and how these can be supported by reusable and consistent techniques across different computing environments (software and hardware). Lack of portable performance evaluation environments force users to adopt different techniques on different systems, even for
common performance analysis.
Strategies
Flexibility and portability are fundamental concerns in the development of a robust parallel performance system
See L. DeRose et al., "Performance Issues in Parallel Processing Systems," Performance Evaluation: Origins and Directions, G. Haring et al. (Eds.), Springer Verlag, Sept. 1999.
See A. Malony, "Tools for Parallel Computing: A Performance Evaluation Perspective," Handbook on Parallel & Distributed Processing, J. Bazewicz et al. (Eds.), Springer, pp. 342-363, 2000.
. We contend that flexibility and portability can best be addressed in the instrumentation and measurement strategies used by an empirical performance system. Moreover, it is in the integration and combination of strategies that the full power of a flexible, portable performance toolkit can be delivered. For instrumentation, these strategies include:
-
Source instrumentation. Most commonly used, it best allows language- and program-level semantics to be associated with performance measurements
See K. Lindlan et al. "A Tool Framework for Static and Dynamic Analysis of Object-Oriented Software with Templates," SC'2000, Nov. 2000.
See S. Shende et al., "Portable Profiling and Tracing for Parallel, Scientific Applications Using C++," Proc. SPDT `98, pp. 134-145, Aug. 1998.
.
-
Compiler instrumentation. Standard routine profiling is common, but more sophisticated techniques handle code transformations and optimizations
See S. Shende, Ph.D. Thesis, University of Oregon, August 2001.
.
-
Object code instrumentation. This typically takes the form of pre-instrumented libraries and supports link-time selection of standard measurement functions
See S. Shende et al., "Portable Profiling and Tracing for Parallel, Scientific Applications Using C++," Proc. SPDT `98, pp. 134-145, Aug. 1998.
.
-
Executable code (dynamic) instrumentation. To address concerns of re-compilation and re-linking, the disabling of optimizations, and runtime control, this modifies program binary code during execution
See B. Buck and J. Hollingsworth, "An API for Runtime Code Patching," Jour. of High Performance Computing Applications, 14(4):317-329, Winter 2000.
See B. Miller et al., "The Paradyn Parallel Performance Measurement Tools," IEEE Computer, 28(11):37-46, Nov. 1995.
.
Similarly, there are several performance measurement strategies of importance:
-
Statistical profiles of software actions. Timing and counting profiles of program events can be captured via sampled or direct methods.
-
Statistical profiles of hardware/OS actions. Performance data of hardware operation can be captured in association with program actions, or separately with system performance data.
-
Program event tracing. Capturing traces of program events portrays the temporal dynamics of software and hardware performance.
Clearly, these strategies are well-known, and each has its advantages and disadvantages. Individually, any one of these strategies is limited in its application. To completely address flexibility and portability concerns, while maintaining robust evaluation coverage, an integration of instrumentation and measurement methods is also desired.
The TAU Performance System
Flexibility and portability have been guiding themes in the development of the TAU performance system
See A. Malony and S. Shende, "Performance Technology for Complex Parallel and Distributed Systems," Proc. DAPSYS 2000, G. Kotsis and P. Kacsuk (Eds.), pp. 37-46, 2000.
See S. Shende et al., "Portable Profiling and Tracing for Parallel, Scientific Applications Using C++," Proc. SPDT `98, pp. 134-145, Aug. 1998.
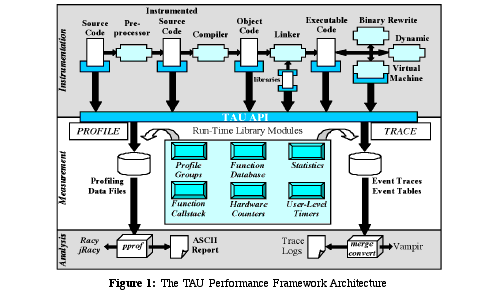
. TAU is based on an integrated framework architecture (see Figure
See The TAU Performance Framework Architecture
) for performance instrumentation, measurement, and analysis of parallel, multi-threaded programs. TAU targets a general complex system computation model, while allowing flexible customization for system-specific needs. Multiple instrumentation and measurement strategies are supported by TAU. Instrumentation support is available at all points in the source-compile-link-execute path, as shown by the dark boxes in the figure. Automated source instrumentation tools are provided
See K. Lindlan et al. "A Tool Framework for Static and Dynamic Analysis of Object-Oriented Software with Templates," SC'2000, Nov. 2000.
and the DyninstAPI
See B. Buck and J. Hollingsworth, "An API for Runtime Code Patching," Jour. of High Performance Computing Applications, 14(4):317-329, Winter 2000.
is used for dynamic instrumentation. The integration of instrumentation and measurement in TAU is achieved in the definition of a common measurement API that each instrumentation mechanism targets. Alternative choices of timing data are available and hardware performance data is accessible through the Performance Counter Library (PCL)
See R. Berrendorf, H. Ziegler, "PCL - The Performance Counter Library: A Common Interface to Access Hardware Performance Counters on Microprocessors," TR FZJ-ZAM-IB-9816, Forschungszentrum Juelich (Germany), Oct. 1998. See http://www.fz-juelich.de/zam/PCL/.
and Performance API (PAPI)
See S. Browne, et al., "A Portable Programming Interface for Performance Evaluation on Modern Processors," Int'l. Jour. of High Performance Computing, 14(3):189-204, Fall 2000.
packages. Flexibility is enhanced in the measurement system through event grouping and statistics configuration. The measurement library also supports the mapping of low-level execution measurements to high-level execution entities (e.g., data parallel statements) so that performance data can be properly assigned. TAU supports both profiling and tracing of software and hardware actions. Profiling and tracing can be performed at the granularity of threads. Post-execution analysis tools are available for parallel performance profile and trace visualization (e.g., the Vampir tool
See Pallas, "VAMPIR - Visualization and Analysis of MPI Resources," 1998.
from Pallas GmbH is commonly used for trace visualization).
Performance Case Study
Limitations on flexibility and portability in an empirical performance system will directly constrain the performance evaluation processes that can be applied using the system. To identify these limitations when they exist, one might look for evaluation scenarios where process constraints arise, and then try to understand their cause. Our proposition is that instrumentation and measurement strategies, plus their integration and composition in a performance system, will be prime determinants of its flexibility and portability, as defined earlier. In the case study that follows, we attempt to study these aspects of the TAU performance system by considering a sequence of process steps for one performance evaluation example, emphasizing where instrumentation and measurement strategies (and their limitations) influence evaluation. Our goal in the study is not to compare TAU to other systems, but rather to highlight the benefits that follow from a comprehensive and integrative set of techniques. As such, we report here our experiences and lessons learned (a posteriori) in developing support for these strategies in TAU, as shortcomings in mechanisms and techniques were encountered.
Evaluation Process and SIMPLE
The process of empirical performance evaluation can be viewed practically as a sequence of performance experiments each describing a set of experiment trials which state necessary instrumentation and measurement requirements to gather performance data for experiment objectives. In this manner, performance behavior is analyzed from trial results to aid in and guide performance problem solving. Certainly, the program whose performance is being studied significantly affects the process of evaluation, in regards to the sequence of experiments composed and conducted, as well as the characteristics of the trial requirements. Since our focus here is on instrumentation and measurement strategies, for sake of simplicity, we choose for evaluation the parallel SIMPLE benchmark, a hydrodynamics and heat conduction simulation program
See C. Lin and L. Snyder, "A portable implementation of SIMPLE," Int'l. Jour. of Parallel Programming, 20(5):363-401, 1991.
. The SIMPLE benchmark is written in C and uses MPI
See Message Passing Interface Forum, "MPI: A Message Passing Interface Standard," Int'l. Jour. of Supercomputer Applications, Vol. 8, 1994.
for message communication.
Source-Level Instrumentation
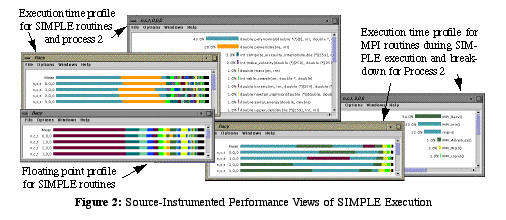
A common starting point for evaluation involves the collection of timing measurements for significant routines. Choice of instrumentation technique affects how trials for this experiment are conducted, but we will begin source-level instrumentation for all SIMPLE routines using the TAU measurement library for profiling. Figure
See Source-Instrumented Performance Views of SIMPLE Execution
shows the timing profile for SIMPLE's routines for a four-process execution. The left window shows the breakdown of inclusive times for each routines for each MPI process, and the right window displays bargraphs for process 2.
While source instrumentation obviously requires re-compilation of the program every time instrumentation is changed, its advantage comes from being able to place instrumentation at any point in the program (as long as source code is available) and to incorporate source-level program knowledge for more sophisticated purposes (e.g., using routine calling parameters to conditional instrumentation). Source-level instrumentation in TAU is macro-based, making it also possible to control instrumentation during compilation. While source instrumentation may be compiled to more efficient code, it can easily disable program optimizations, and certain code optimizations, if not properly tracked, may lead to erroneous performance reporting
See S. Shende, Ph.D. Thesis, University of Oregon, August 2001.
.
A convenient mechanism to instrument libraries without source access is to use a wrapper interposition library. If the library designer provides alternative entry points for some or all routines, a new library that reimplements the standard API can be interposed to instrument routine entry and exit events, calling the associated routine in between. MPI's profiling interface
See Message Passing Interface Forum, "MPI: A Message Passing Interface Standard," Int'l. Jour. of Supercomputer Applications, Vol. 8, 1994.
operates in this manner, and we have used it to instrument the native MPI library with TAU (see Figure 2). Note, in addition to intercepting calls to library routines, this strategy can also expose routine arguments, allowing instrumentation to track the size of messages, identify message tags, or invoke other native library routines (e.g., to track the sender and the size of a received message within a wild-card receive call).
Source-level instrumentation typically makes calls to a measurement API (e.g., the TAU API) whose library is linked to the program. This aids greatly in portability as the API becomes a common definition for measurement across platforms. Flexibility is also enhanced by the ability to link differently configured libraries. For instance, it is possible to switch between profiling and tracing in TAU during program compilation, keeping the source instrumentation exactly the same, just by selecting the appropriate measurement library versions. Figure
See Trace of SIMPLE using MPI wrapper-based source instrumentation.
shows the trace of MPI events and message communication in the SIMPLE execution. Views from the Vampir visualization tool are used.

TAU also provides for hardware measurements in this manner, constructing a measurement library with hardware counter capabilities from PCL
See R. Berrendorf, H. Ziegler, "PCL - The Performance Counter Library: A Common Interface to Access Hardware Performance Counters on Microprocessors," TR FZJ-ZAM-IB-9816, Forschungszentrum Juelich (Germany), Oct. 1998. See http://www.fz-juelich.de/zam/PCL/.
or PAPI
See S. Browne, et al., "A Portable Programming Interface for Performance Evaluation on Modern Processors," Int'l. Jour. of High Performance Computing, 14(3):189-204, Fall 2000.
, depending on the system platform. Figure
See Source-Instrumented Performance Views of SIMPLE Execution
also shows the profiling of floating point operations for all SIMPLE routines.
Dynamic Instrumentation
It is clear that a source instrumentation strategy, coupled with configurable measurement strategies, can be quite powerful. However, there are several limitations of source-level instrumentation that can impact flexibility. The overhead of recompilation is undesirable in cases of large programs, and only source-accessible events are candidates for instrumentation. This can be a problem for system routines and proprietary libraries (ones not exposing their interfaces for wrapper interposition). Execution code instrumentation (a.k.a., dynamic instrumentation or runtime code-patching) offers an effective means of instrumenting an application when requirements for performance observation restrict source instrumentation. Dynamic instrumentation also can be used in the presence of compiler optimization and instrumentation inserted can be removed during execution. However, dynamic instrumentation is not a panacea, since it is restricted to certain processor architectures, requires some sophistication to use with alternative measurement mechanisms, and will incur additional runtime overhead.

Using DyninstAPI in TAU
TAU package does not implement dynamically instrumentation internally. Rather, like the integration of PAPI and PCL technology, the external DyninstAPI technology is utilized. DyninstAPI
See B. Buck and J. Hollingsworth, "An API for Runtime Code Patching," Jour. of High Performance Computing Applications, 14(4):317-329, Winter 2000.
is a dynamic instrumentation package that allows a tool to insert code snippets into a running program using a portable C++ class library. For DyninstAPI to be useful with a measurement strategy, calls to a measurement library (or the measurement code itself) must be correctly constructed in the code snippets. Our approach for TAU uses the DyninstAPI to construct calls to the TAU measurement library and then insert these calls into the executable code. We do this prior to execution by a mutator program (tau_run). The mutator loads a TAU dynamic shared object (the compiled TAU measurement library) in the address space of the mutatee (the application program). It parses the executable image for symbol table information and generates the list of modules and routines within the modules that are appropriate for instrumentation; TAU routines and Dyninst modules are excluded from consideration. Using the list of routines and their names, unique identifiers are assigned to each routine. The list of routines is then passed as an argument to a TAU initialization routine that is executed once by the mutatee (as a one time code). This initialization routine creates a function mapping table to aid in efficient performance measurement. Code snippets are then inserted at entry and exit transition points in each routine. To allow selective instrumentation, a list of to-be-instrumented routine names could be provided to the mutator.
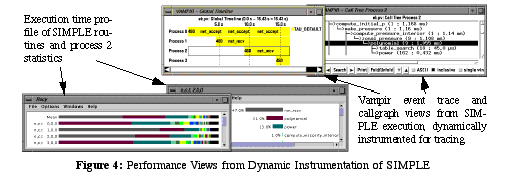
Following the above dynamic instrumentation approach, it is possible to derive a TAU profile measurement of execution time for all SIMPLE routines. This is shown in Figure
See Performance Views from Dynamic Instrumentation of SIMPLE
. Gathering hardware counts is also possible. While profiling returns summary statistics, it cannot reveal the dynamic calltree of a process. To do this, we need to examine event traces. This is possible with source instrumentation and it is also possible with dynamic instrumentation by loading a differently configured TAU measurement library. Figure
See Performance Views from Dynamic Instrumentation of SIMPLE
shows Vampir callgraph views for a SIMPLE trace produced from dynamic instrumentation. Thus, because the TAU dynamic instrumentation strategy, like source instrumentation, targets the TAU measurement, it is independent of the type of measurements that are performed. This gives us flexibility in choosing either tracing and/or profiling. Preconfigured versions of the TAU library that support a variety of measurement choices can be chosen as a command line argument to tau_run.
Issues with MPI
The above scheme works well with sequential programs that are spawned by TAU after inserting instrumentation. To get the correct performance data used in Figure
See Performance Views from Dynamic Instrumentation of SIMPLE
, we had to solve a more challenging problem with MPI. MPI programs execute in a SPMD fashion by spawning multiple copies of the executable across one or more compute nodes in a network using the program mpirun. If we want to dynamically instrument a MPI program, when should we do it? There are three possible choices:
-
use one mutator to instrument the original executable image before spawning,
-
use an online mutator to instrument the spawned executable images after they have started execution, or
-
spawn a mutator with each spawned executable image.
The first approach is effectively a binary rewriting approach. While Dyninst does not currently support binary rewriting, the PAT tool for the Cray T3E
See J. Galarowicz, and B. Mohr, "Analyzing Message Passing Programs on the Cray T3E with PAT and VAMPIR," TR IB-9809, ZAM Forschungszentrum Juelich (Germany), May 1998.
does provide this capability and has been used to analyze MPI programs. The second approach is being promoted by Paradyn
See B. Miller et al., "The Paradyn Parallel Performance Measurement Tools," IEEE Computer, 28(11):37-46, Nov. 1995.
and DPCL (Dynamic Probe Class Library)
See PTOOLS, "Dynamic Probe Class Library," 2000. See http://www.ptools.org/projects/dpcl.
. These systems provide the capability of modifying instrumentation at runtime using a client-server architecture. There will be additional overhead to perform instrumentation in this way, but the flexibility of runtime instrumentation control may be significant.

Like Dynaprof
See University of Tennessee, "Dynaprof." See http://www.cs.utk.edu/~mucci/dynaprof/.
, we chose the third approach because our interest is in dynamic instrumentation prior to execution. This allows multiple instrumentors to simultaneously instrument each executable image prior to its execution. The mutator spawns the mutatee after inserting TAU annotations and waits for the child process to terminate.This is accomplished by passing a shell script to the mpirun process. The shell script then executes the tau_run and specifies:
-
the TAU dynamic shared library to use for measurement,
-
the location of the application (mutatee) image, and
-
any command line arguments that should be passed to the mutatee.
While this is sufficient to dynamically instrument a MPI program, how does the TAU measurement library know that the executable image is a MPI program? To generate performance data for such a parallel application and to distinguish it from sequential applications, TAU searches for MPI bindings in the executable image. If these are found, it instruments the MPI_Comm_rank routine to find out the global rank of the process involved in the computation. It passes this information to TAU which uses it to store performance data for each MPI process.
Conclusions and Future Work
Parallel performance problem solving depends on robust systems for empirical performance evaluation. Flexbility and portability in empirical methods and processes are influenced primarily by the strategies available for instrumentation and measurement, and how effectively they are integrated and composed. In this brief paper, we have described how the TAU performance system works with different instrumentation and measurement strategies to address diverse requirements for performance observation. Our study suggest that the flexbility and portability of the TAU system is indeed improved by the integration of these strategies, and special performance observation problems can be solved from innovative composition of their features.
There are several empirical performance evaluation problems that are still challenging. For instance, TAU currently supports several thread packages, including pthreads, OpenMP, Java, and Windows threads for source and virtual machine level instrumentation. Extending this support for threads at the binary instrumentation level requires higher-level knowledge of the type of thread system used and thread specific events, such as thread creation and thread termination. The Dyninst project is planning to provide thread support and TAU will be able to utilize this for more refined threads measurements.
Another area where there is an opportunity for improvement is in the combination of software and hardware monitoring. TAU currently restricts performance experiments to measure a single performance metric: execution time or hardware counter. However, PAPI
See S. Browne, et al., "A Portable Programming Interface for Performance Evaluation on Modern Processors," Int'l. Jour. of High Performance Computing, 14(3):189-204, Fall 2000.
, for example, provides support for accessing multiple counter values. Our next step is to give the TAU user the ability to record more than one metric for a performance event. This would allow TAU to correlate different metrics for a performance experiment. The challenge to doing so is not merely in being able to record different performance data, but in presenting the performance data in a coherent manner. The Vampir
See Pallas, "VAMPIR - Visualization and Analysis of MPI Resources," 1998.
trace visualizer is being extended to allow events to be shown with multiple performance values in timeline displays. This would permit hardware performance counter information to be super-imposed on the existing global timeline and would highlight the magnitude, spatial and temporal locations (when and where), and concentration of performance features.
References
-
R. Berrendorf, H. Ziegler, "PCL - The Performance Counter Library: A Common Interface to Access Hardware Performance Counters on Microprocessors," TR FZJ-ZAM-IB-9816, Forschungszentrum Juelich (Germany), Oct. 1998. See http://www.fz-juelich.de/zam/PCL/.
-
S. Browne, et al., "A Portable Programming Interface for Performance Evaluation on Modern Processors," Int'l. Jour. of High Performance Computing, 14(3):189-204, Fall 2000.
-
B. Buck and J. Hollingsworth, "An API for Runtime Code Patching," Jour. of High Performance Computing Applications, 14(4):317-329, Winter 2000.
-
L. DeRose et al., "Performance Issues in Parallel Processing Systems," Performance Evaluation: Origins and Directions, G. Haring et al. (Eds.), Springer Verlag, Sept. 1999.
-
J. Galarowicz, and B. Mohr, "Analyzing Message Passing Programs on the Cray T3E with PAT and VAMPIR," TR IB-9809, ZAM Forschungszentrum Juelich (Germany), May 1998.
-
C. Lin and L. Snyder, "A portable implementation of SIMPLE," Int'l. Jour. of Parallel Programming, 20(5):363-401, 1991.
-
K. Lindlan et al. "A Tool Framework for Static and Dynamic Analysis of Object-Oriented Software with Templates," SC'2000, Nov. 2000.
-
A. Malony, "Tools for Parallel Computing: A Performance Evaluation Perspective," Handbook on Parallel & Distributed Processing, J. Bazewicz et al. (Eds.), Springer, pp. 342-363, 2000.
-
A. Malony and S. Shende, "Performance Technology for Complex Parallel and Distributed Systems," Proc. DAPSYS 2000, G. Kotsis and P. Kacsuk (Eds.), pp. 37-46, 2000.
-
Message Passing Interface Forum, "MPI: A Message Passing Interface Standard," Int'l. Jour. of Supercomputer Applications, Vol. 8, 1994.
-
B. Miller et al., "The Paradyn Parallel Performance Measurement Tools," IEEE Computer, 28(11):37-46, Nov. 1995.
-
Pallas, "VAMPIR - Visualization and Analysis of MPI Resources," 1998.
-
PTOOLS, "Dynamic Probe Class Library," 2000. See http://www.ptools.org/projects/dpcl.
-
S. Shende, Ph.D. Thesis, University of Oregon, August 2001.
-
S.
Shende et al., "Portable Profiling and Tracing for Parallel, Scientific Applications Using C++," Proc. SPDT `98, pp. 134-145, Aug. 1998.
-
S. Shende and A. Malony, "Integration and Application of the TAU Performance System in Parallel Java Environments," ACM Java Grande / ISCOPE 2001, June 2001.
-
University of Oregon, "TAU." See http://www.cs.uoregon.edu/research/paracomp/tau/.
-
University of Tennessee, "Dynaprof." See
http://www.cs.utk.edu/~mucci/dynaprof/.
