This program analysis mechanism allows a user to control the execution of a pC++ program and to view the parallel program collection data during the execution, the essential functions of a parallel debugger. The execution is controlled by manipulating program breakpoints. At these breakpoints, the program data can be displayed in a text window or visualized by a compatible visualization tool.
Using breezy, the execution of a pC++ program proceeds in steps. At breakpoint boundaries, the application relinquishes control to the breakpoint executive. The user then interacts with the breakpoint executive through the external debugger interface to access the program state. Once finished, the user instructs the executive to continue to the next breakpoint or to the end of the program. During an initial barrier, the executive connects to the interface agent via an Internet domain TCP/IP socket. This method of control allows a user to manipulate the program and its data from any machine that is accessible by the parallel host on which the pC++ application is actually executing.
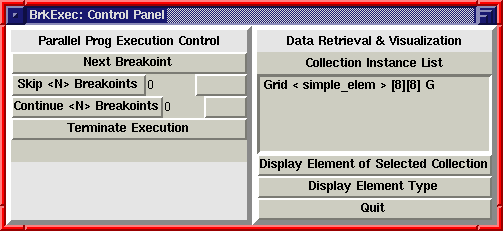
The interface agent offers a main panel (see picture below) for controlling program execution and listing currently active collections that are available to be accessed. From this panel, the user has control of when to stop and what data to examine. Currently, to control the program execution, the user can step from each breakpoint to the next, specify a number of breakpoints to skip before again pausing to examine the data, or continue or terminate the parallel application.

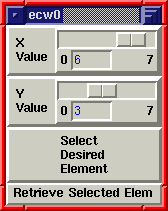
To look at a particular element, the user selects the Collection they are interested in from the main window and chooses the "Display Element of Selected Collection" button. A window appears in which the user specifies the indices of the particluar element of interest (see gif below).

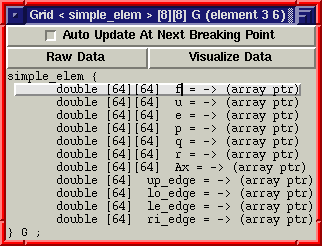
The result of an element retrieval is formatted to emulate a C++ style declaration (see picture below).

Selecting the Auto Update toggle button causes the data values to be updated with current information at each breakpoint. The remaining two buttons are for viewing raw data and visualizing the data. These last two buttons work in concert with the display of the element structure. Any one of the fields of the displayed structure can be selected with the mouse. This selection specifies which field is to be viewed or visualized. Thus, until a selection is made, the two buttons are disabled.
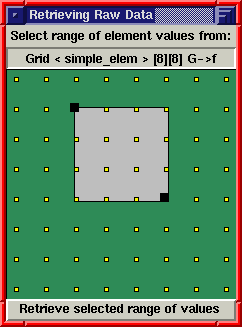
After the user selects the particular field of interest, Breezy allows the user to specify which elements to retrieve the data from. In this case, the distributed collection is a two dimensional grid, so a graphical widget is used to specify which elements on this grid are of interest.

The user can retrieve raw data from a structure as text, which is put into a scrollable window for viewing. This window contains the automatic update toggle button which works as described above.
The user can also visualize the parallel data retrieved. When a user chooses to visualize a field of a structure, a new window is created in which the user must specify the range of elements to retrieve from the collection instance. Also, the user must select a visualization from a menu of the provided (and user-defined) visualizations. After these user specifications, the visualization can be started. Separate processes are spawned from the interface to accomplish the visualizations, and then data is piped into them. The visualization performs the mapping of data to graphical objects, producing a visualization/animation of the collection data (see Figure 6). After starting a visualization, a small interface window remains behind, informing the user about the visualization, and again offering the automatic update toggle button. As in other windows, if this button is selected the visualization will be sent current information at each breakpoint, thus supplying the data for an animation during the execution of the program.