

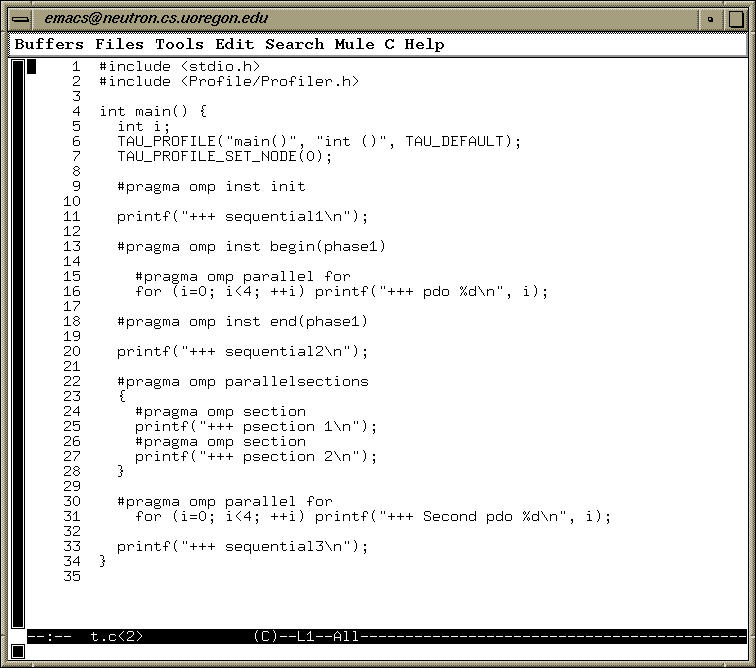
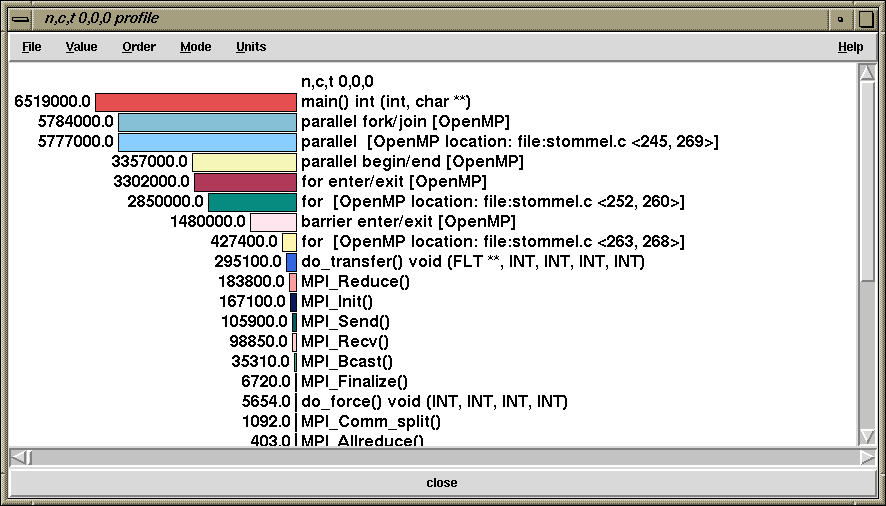
TAU generates profiles for this application as shown below:
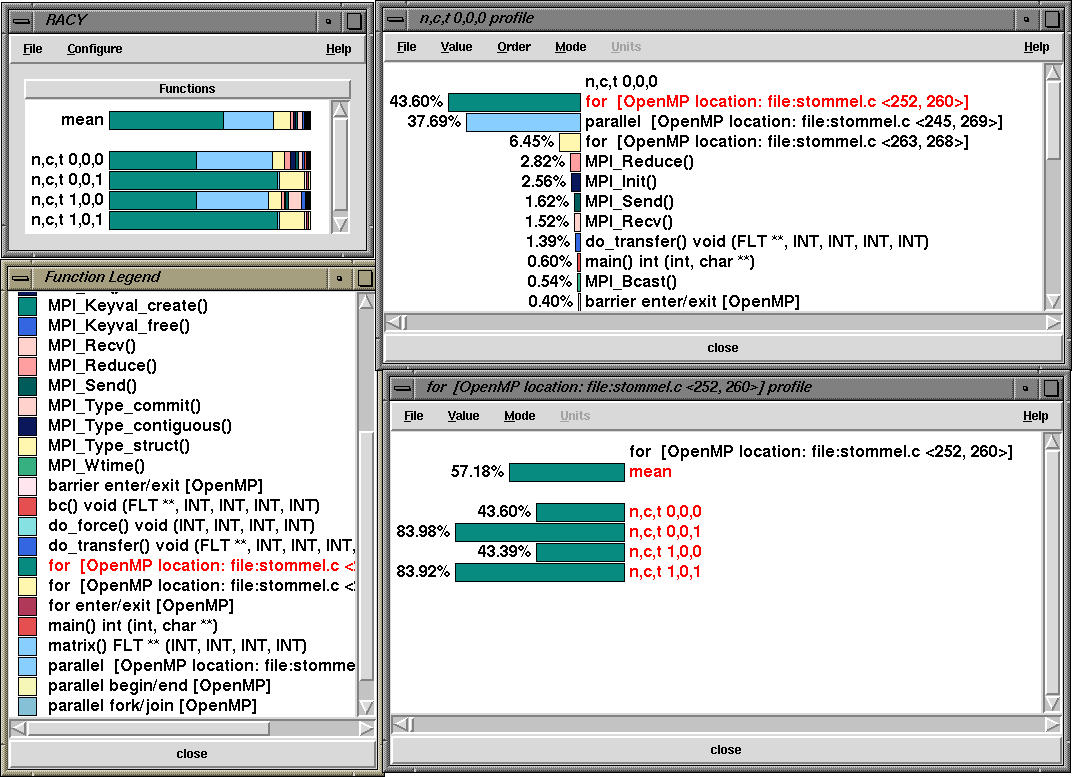
Here, we see that the for loop that is spread across lines 252-260 takes up a significant portion of time. The exclusive time spent in different OpenMP constructs and regions for node 0, thread 0 is shown below:
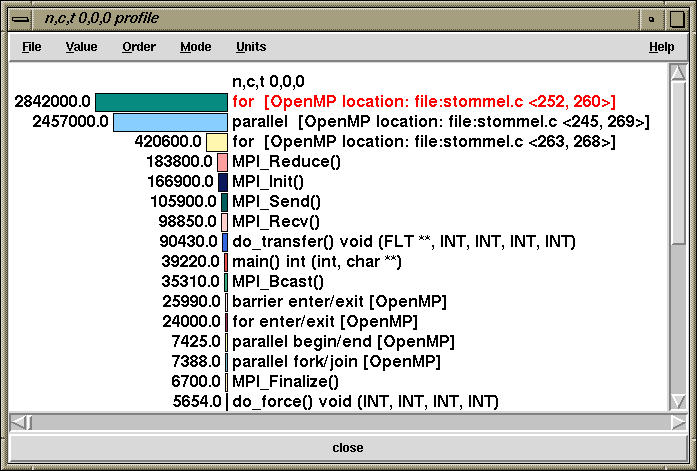
On the other hand, the inclusive time is shown below:
This corresponds to the following source code:
    252 #pragma omp for schedule(static) reduction(+: diff) private(j) firstprivate (a1,a2,a3,a4,a5)
    253     for( i=i1;i<=i2;i++) {
    254         for(j=j1;j<=j2;j++){
    255             new_psi[i][j]=a1*psi[i+1][j] + a2*psi[i-1][j] +
    256                          a3*psi[i][j+1] + a4*psi[i][j-1] -
    257                          a5*the_for[i][j];
    258             diff=diff+fabs(new_psi[i][j]-psi[i][j]);
    259          }
    260     }
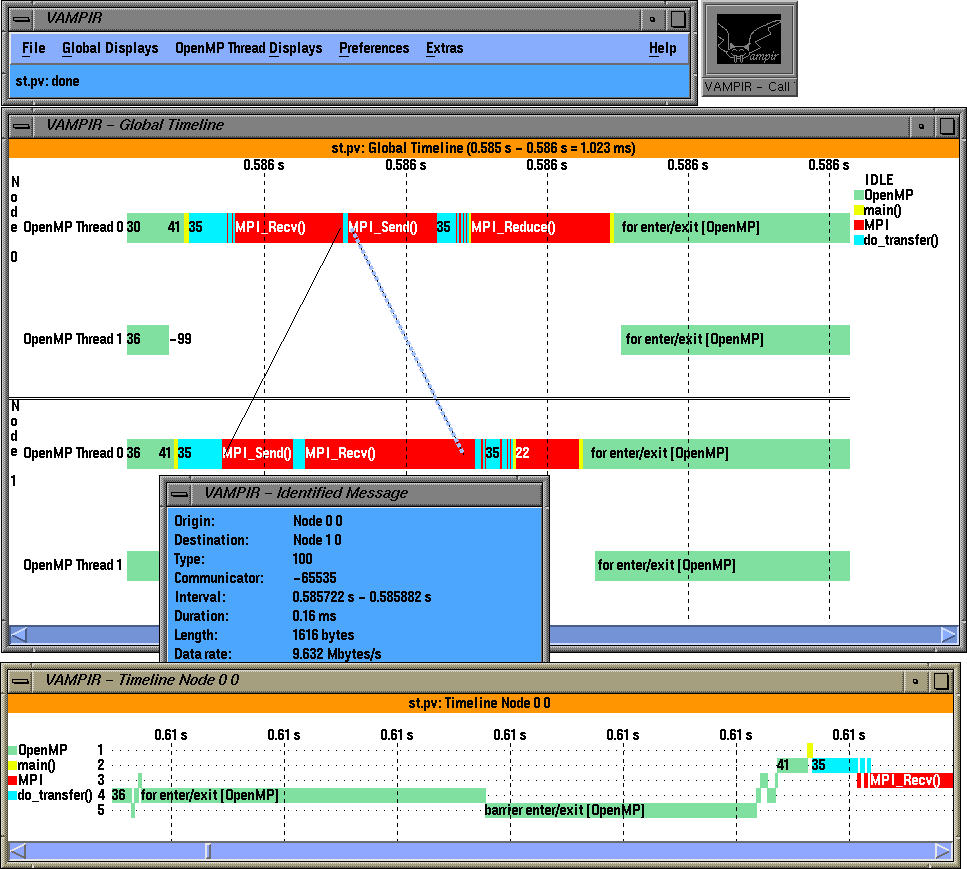
Here, we see a global timeline display of a trace generated by TAU. It highlights
an integrated hybrid execution model comprising of MPI (all MPI routines and
messages) and OpenMP events (OpenMP parallel regions and loops). Each OpenMP
thread is shown independently on the timeline and we see the load imbalance
and when and where it takes place. Inter-process communication events are
shown at the level of each thread. Although MPI layer does not have any
information about the sending and receiving thread, TAU can match sends and
receives and generate a Vampir trace where the precise thread involved in the
synchronization operation is shown. So, the display shows the global timeline
along the X axis and the MPI tasks and threads grouped within the tasks along the Y axis. Also, TAU uses a high level grouping of all events, so in the left, we
can see the contribution of all "MPI" and "OpenMP" constructs.
Note that each OpenMP thread is shown distinctly within the SMP node and MPI events are integrated in the trace. TAU can accurately track the precise thread with which inter-process communicatation events are associated. OpenMP level instrumentation highlights the time spent in for and barrier code regions (specified by pragmas).

The parallelism and the global activity displays in Vampir shows the breakdown of activities. In the Global Activity Chart, we see a pie chart that shows the color coded contribution of each code segment on each OpenMP thread within the two MPI tasks.
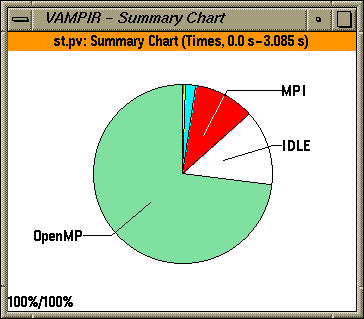
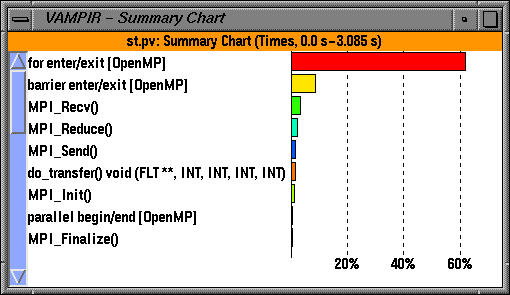
In the summary charts, we see the contribution of OpenMP, MPI and application constructs aggregated over all threads of execution. The application uses OpenMP for loop level parallelism in an MPI program and was written by Timothy Kaiser (SDSC). It solves the 2d Stommel model of ocean circulation using a five-point stencil and Jacobi iteration
 gamma*((d(d(psi)/dx)/dx) + (d(d(psi)/dy)/dy))
 +beta(d(psi)/dx)=-alpha*sin(pi*y/(2*ly))