TAU and PAPI
DOWNLOAD
% configure -arch=sgi64 -papi=/research/paraducks/apps/papi -mpiinc=/local/apps/mpich/include -mpilib=/local/apps/mpich/lib/IRIX64/ch_p4
% setenv PAPI_EVENT PAPI_FP_INS
% mpirun -np 4 lu.W.4
 NAS Parallel Benchmarks 2.2 -- LU Benchmark

 Size:  33x 33x 33
 Iterations: 300
 Number of processes:     4

 Time step    1
 Time step   20
 Time step   40
 Time step   60
 Time step   80
 Time step  100
 Time step  120
 Time step  140
 Time step  160
 Time step  180
 Time step  200
 Time step  220
 Time step  240
 Time step  260
 Time step  280
 Time step  300

 Verification being performed for class W
 Accuracy setting for epsilon =  0.1000000000000E-07
 Comparison of RMS-norms of residual
           1   0.1236511638192E+02 0.1236511638192E+02 0.1465318983036E-12
           2   0.1317228477799E+01 0.1317228477799E+01 0.3777643499391E-12
           3   0.2550120713095E+01 0.2550120713095E+01 0.9194823664494E-13
           4   0.2326187750252E+01 0.2326187750252E+01 0.1846086008657E-12
           5   0.2826799444189E+02 0.2826799444189E+02 0.1519467837203E-12
 Comparison of RMS-norms of solution error
           1   0.4867877144216E+00 0.4867877144216E+00 0.5074586224359E-13
           2   0.5064652880982E-01 0.5064652880982E-01 0.9426033961409E-13
           3   0.9281818101960E-01 0.9281818101960E-01 0.1584867847515E-13
           4   0.8570126542733E-01 0.8570126542733E-01 0.8096606122801E-14
           5   0.1084277417792E+01 0.1084277417792E+01 0.2568013775875E-12
 Comparison of surface integral
               0.1161399311023E+02 0.1161399311023E+02 0.3104879045267E-13
 Verification Successful


 LU Benchmark Completed.
 Class           =                        W
 Size            =               33x 33x 33
 Iterations      =                      300
 Time in seconds =                    95.18
 Total processes =                        4
 Compiled procs  =                        4
 Mop/s total     =                   189.75
 Mop/s/process   =                    47.44
 Operation type  =           floating point
 Verification    =               SUCCESSFUL
 Version         =                      2.3
 Compile date    =              12 Apr 2000

 Compile options:
    MPIF77       = f90 $(ABI)
    FLINK        = $(TAU_CXX)
    FMPI_LIB     = $(TAU_MPI_FLIBS) $(TAU_LIBS) $(LEXTRA1) $(T...
    FMPI_INC     = $(TAU_MPI_INCLUDE)
    FFLAGS       = -O3
    FLINKFLAGS   = (none)
    RAND         = (none)


 Please send the results of this run to:

 NPB Development Team
 Internet: npb@nas.nasa.gov

 If email is not available, send this to:

 MS T27A-1
 NASA Ames Research Center
 Moffett Field, CA  94035-1000

 Fax: 415-604-3957
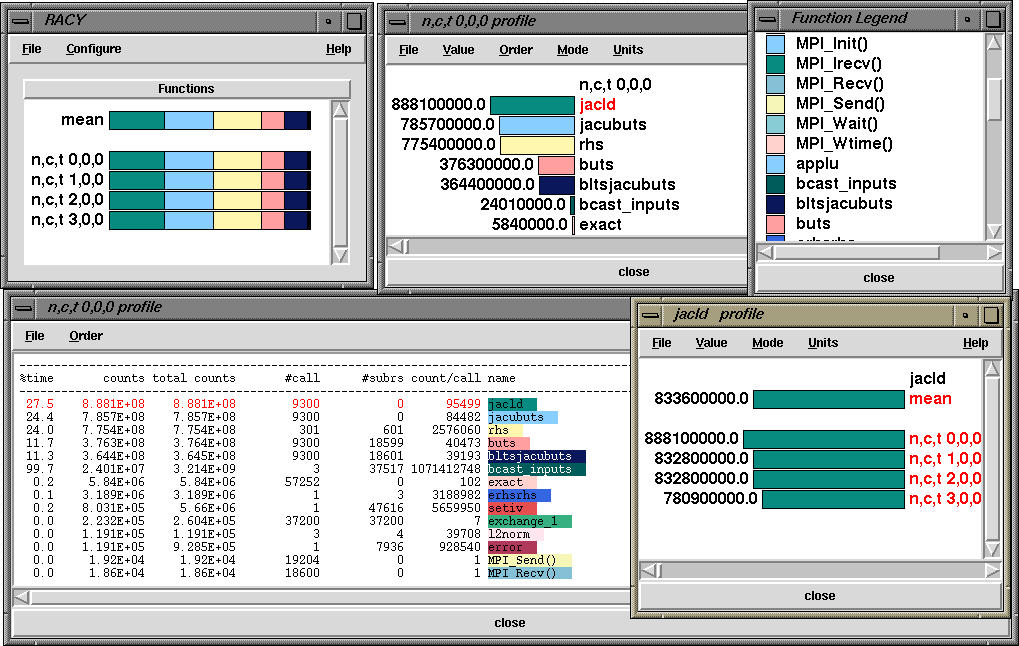
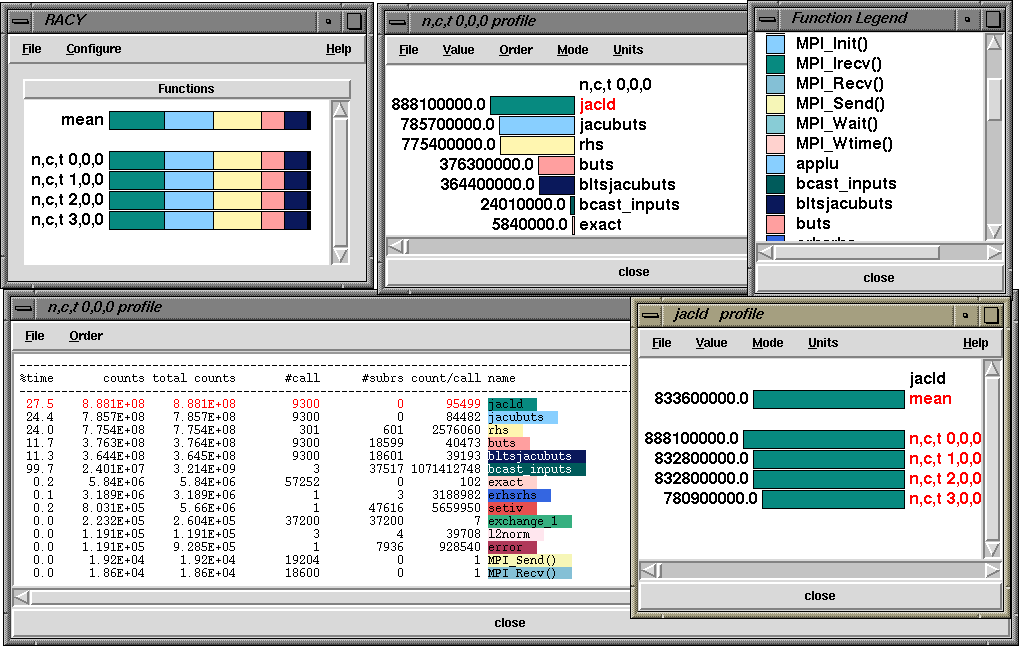
This generates the following profile on four processors of an SGI Power Onyx
(eight R10000 194Mhz processors)
        foo {

          f1(); -> takes 10 fp operations

          f2(); -> takes 20 fp operations
        }  ---> 100 operations from start to finish in foo
Then, foo has "inclusive count" of 100, and "exclusive count" of
70. If foo is called once and it calls 2 routines (f1 and f2), then we
show calls for foo as 1 and Subrs for foo as 2. count/call shows the
inclusive counts for foo/no. of calls.
So, getting back to the display, the top right window shows that "jacld" accounts for most floating point counts on that process. When I right click on "jacld" it brings up the jacld profile that shows me the profile of that routine on all nodes. So, we see that it had 8888100000 floating point counts on node 0, context 0, thread 0 (rank=0), and 780900000 floating point counts on node 3, context 0, thread 0 (rank=3) process. We can choose from exclusive and inclusive options from the menu as well as percentage or real values. It also highlights (in red) the routine in all other windows. In the text window we can see that on node 0, context 0, thread 0, the routine "bcase_inputs" (shown in green) had 2.401E+7 exclusive counts and 3l214E+9 inclusive counts (99.7% of total). It was called 3 times and it in turn called 37517 other routines, and had an 1071412748 inclusive counts/call.
The user can get a similar explanation when the Help option is selected from the window.