
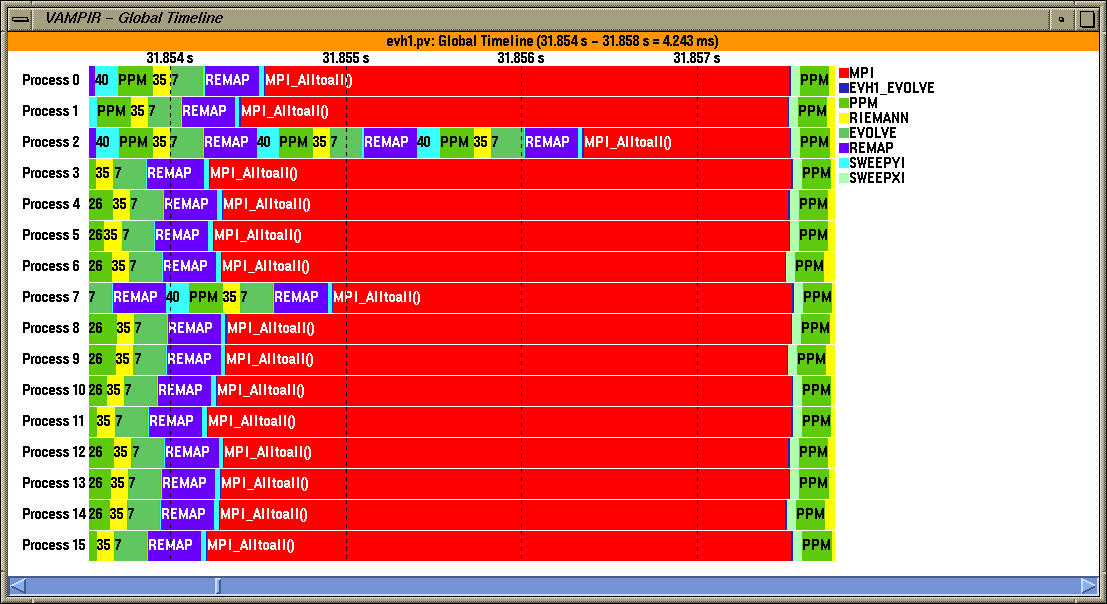
In the global timeline view, the user can zoom into a trace segment as shown above.
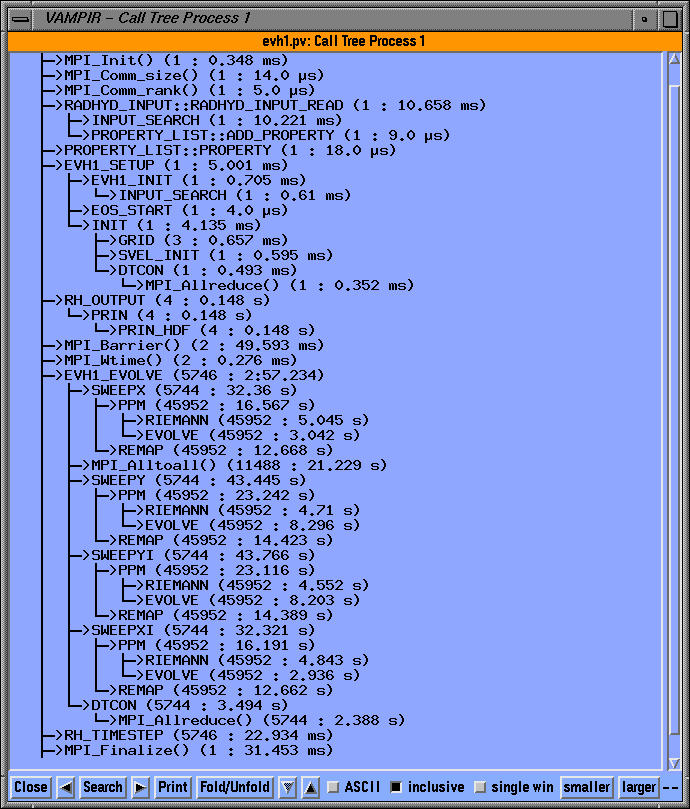
In the dynamic calltree view (for process 1), we can see the calling order annotated with performance metrics. In the inclusive view, the number of calls and the inclusive time spent in the routine is shown. Note the performance of EVH1_EVOLVE as it calls SWEEPX, SWEEPY, MPI_Alltoall in the calltree.
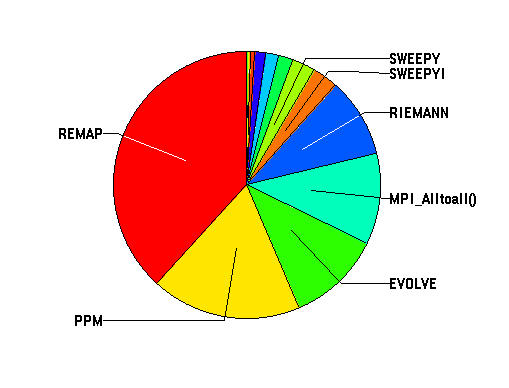
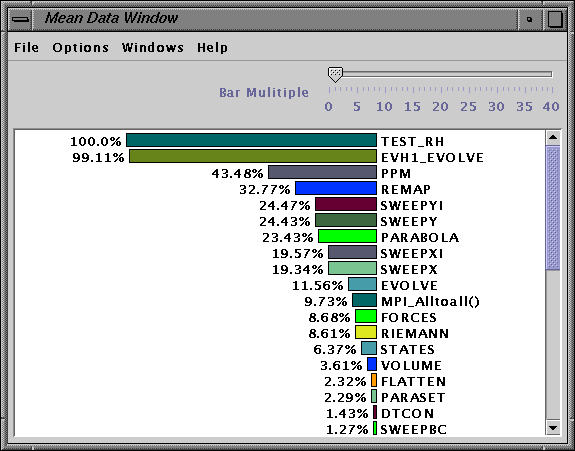
The summary view is shown above as a pie chart.
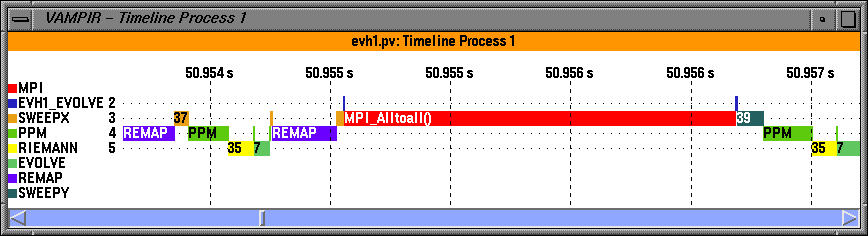
The timeline view highlights the level of nesting on process 1.
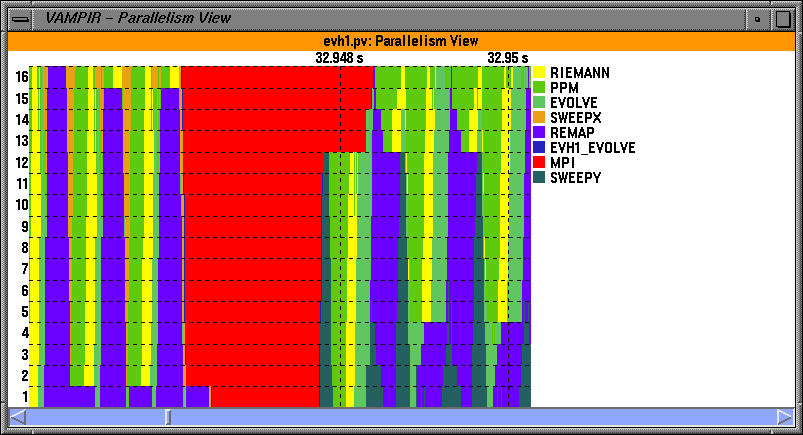
The parallelism view shows the number of processes that participate in an activity at a given time. NOTE: TAU supports selective instrumentation. This allows us to exclude certain light-weight routines. Here, PARABOLA, FORCE and other routines were chosen for exclusion based on their execution frequency.
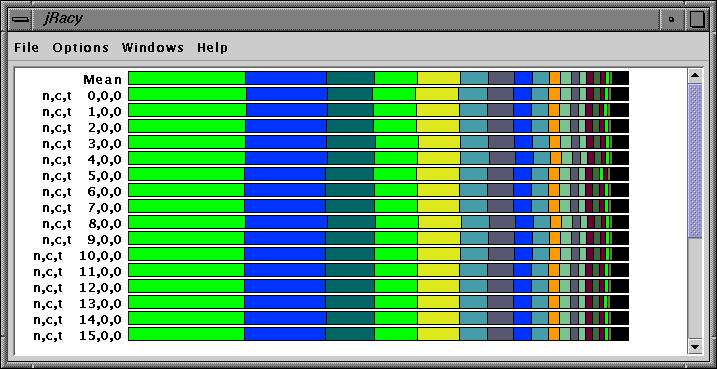
TAU's jracy profile browser shows the profile of EVH1. The program executes on 16 processors. EVH1 and MPI routines are represented by distinct colors. The task has a regular behavior on all nodes.
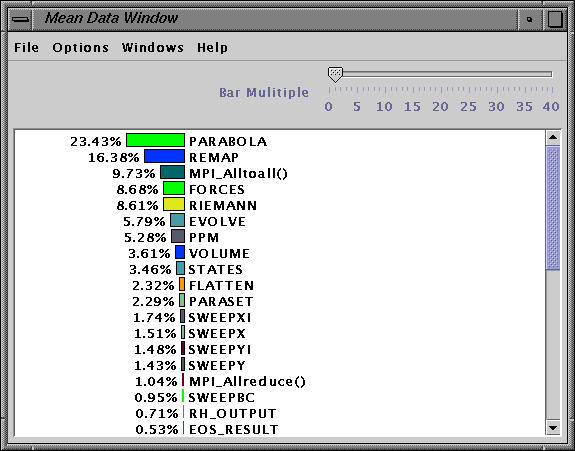
By clicking on mean, we can view more details. The exclusive time spent in each process is shown in this view.
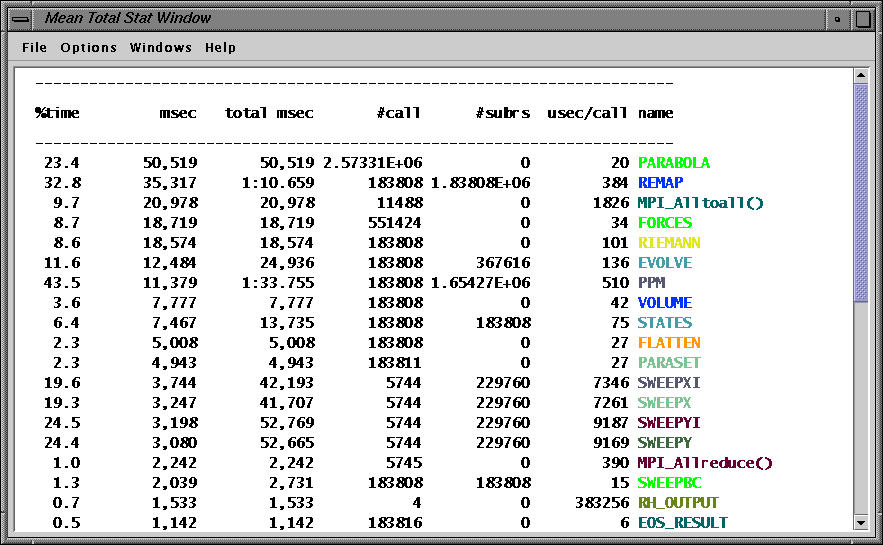
The text window shows the mean time spent (over 16 nodes) in different routines.
Jracy allows the user to sort the performance metrics in different ways. The above windows shows the mean inclusive time.
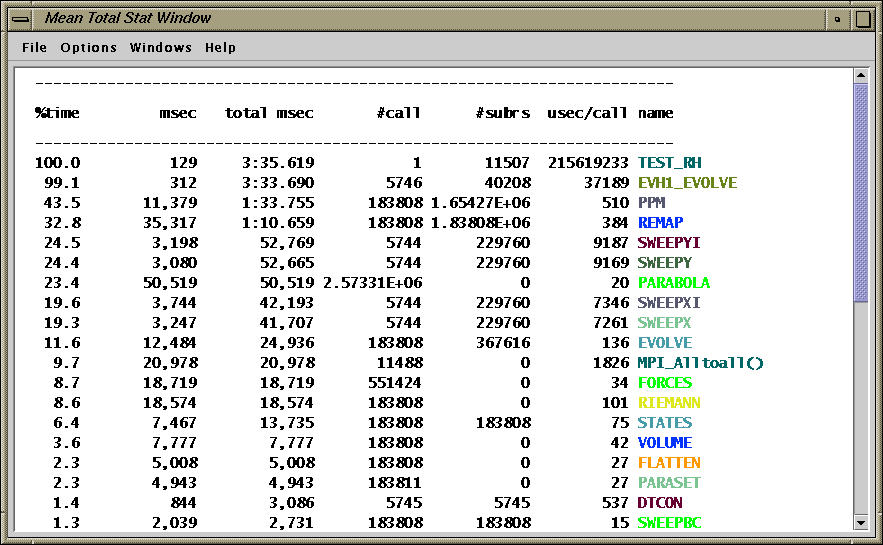
The text view of the same.
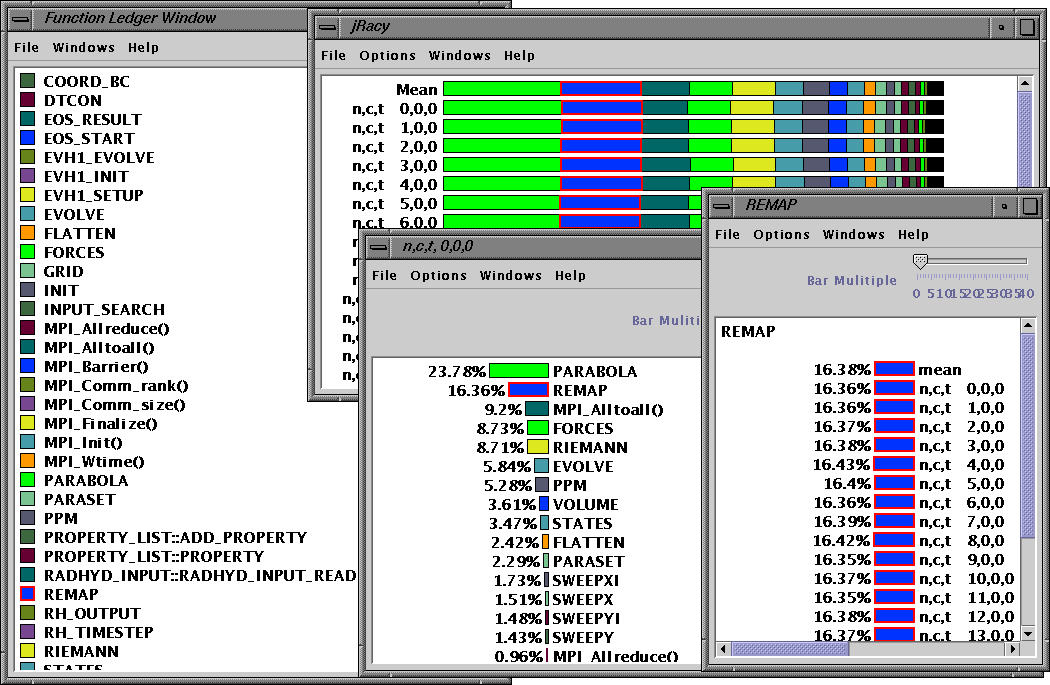
On the left, we can see the function legend and on the right the exclusive time spent in the REMAP routine.
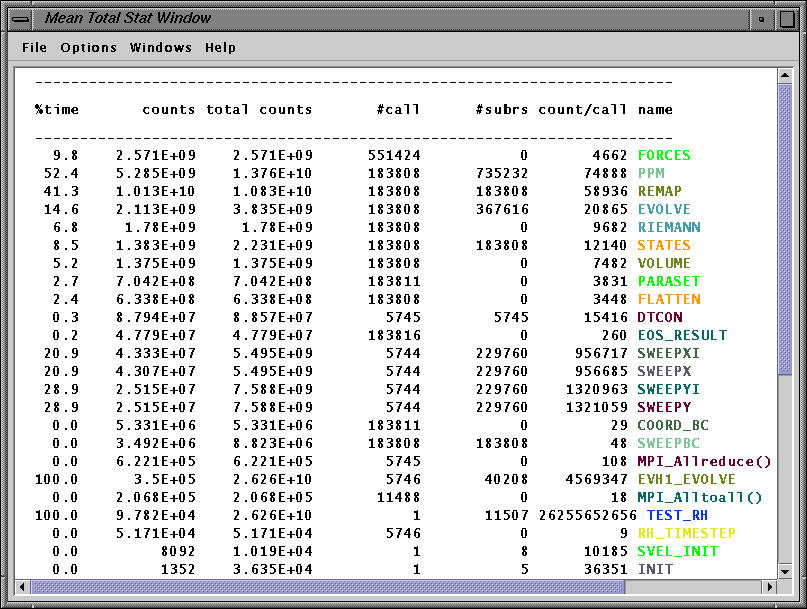
The mean window (over 16 processors) shows the exclusive and inclusive floating point counts for all routines (when PARABOLA was not instrumented).
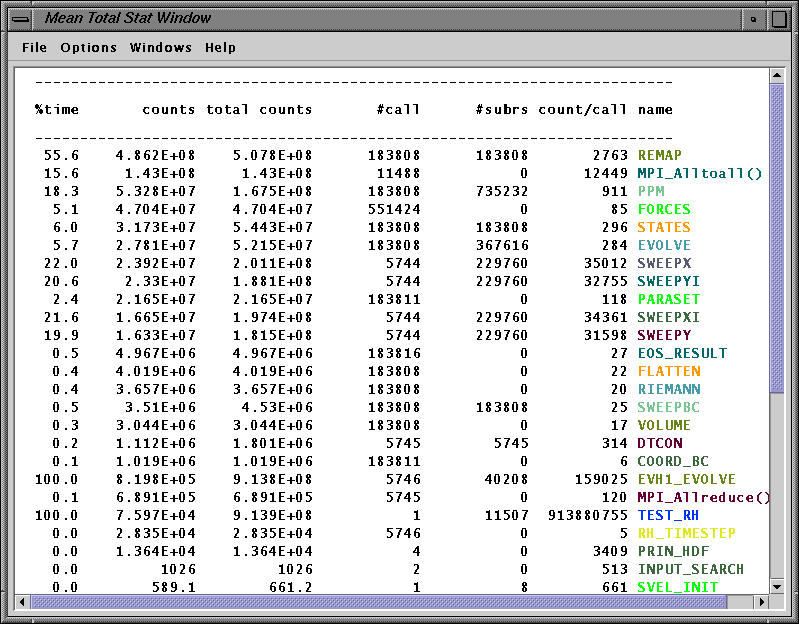
The mean window (over 16 processors) shows the exclusive and inclusive level 1 data cache misses for all routines (except PARABOLA).