 PETSc
PETSc
PETSc
PETSc
-pdt=< dir > -mpiinc=< dir > -mpilib=< dir > options. Execute the application to generate profile and/or trace data. NOTE: You need TAU v 2.11.16 or better for PETSc.
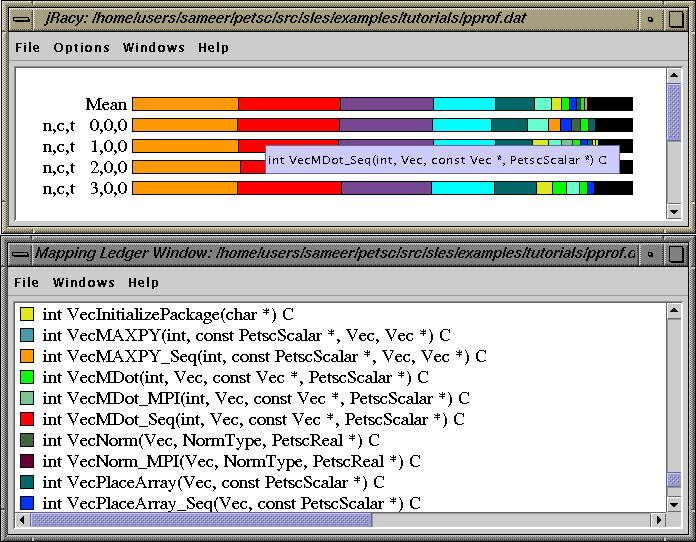
The above display (jracy) shows the profile of ex2 example (using make BOPT=g) from the petsc/src/sles/examples/tutorials directory (-m 200 -n 200). It was executed on four processors (node 0 through 3 in the main display). n,c,t 1,0,0 stands for node 1, context 0, thread 0. Color coded routines are seen in the Ledger window below.
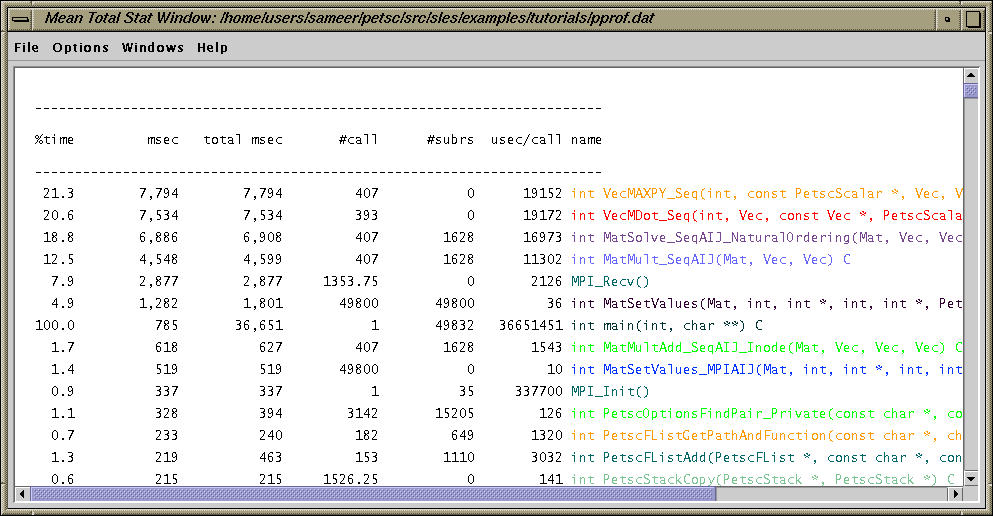
By clicking the middle mouse button over "mean" in the main racy window, we see the average text profile over all nodes. The routines can be sorted in different ways. Here, the routines are sorted according to the exclusive time. VecMAXPY_Seq routine takes the most exclusive time (followed by VecMDot_Seq).
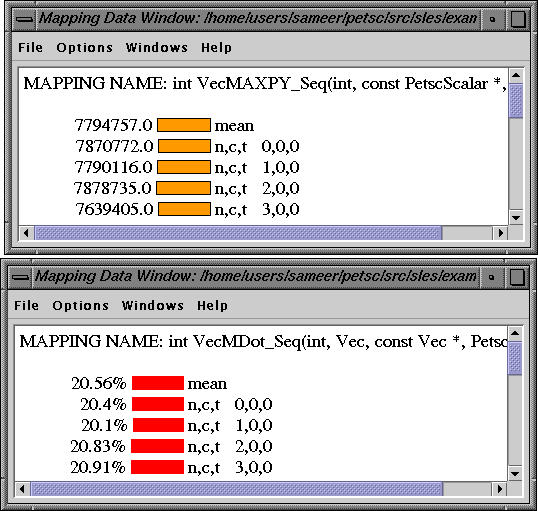
Clicking on the routine names or colors shows the breakdown of the routine over all nodes. The inclusive or exclusive time spent in the routine can be displayed in microseconds (msecs or secs) or as a percentage of the total time on that node.
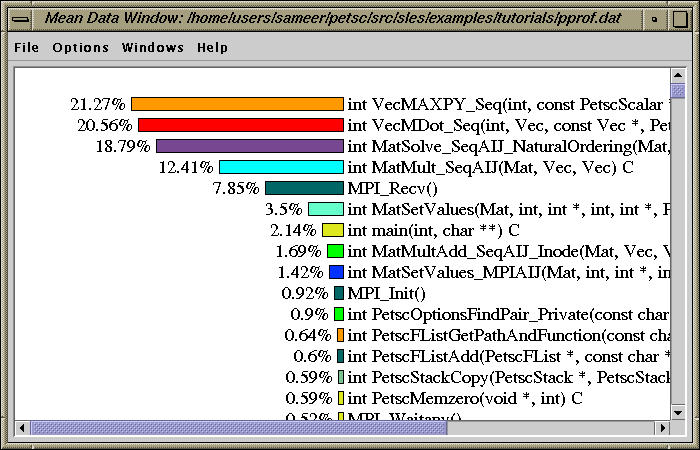
Clicking the first mouse button on a particular node (mean in this case) in the main racy window shows the breakdown of time spent in routines in that node. The Options menu shows various sorting and display options.
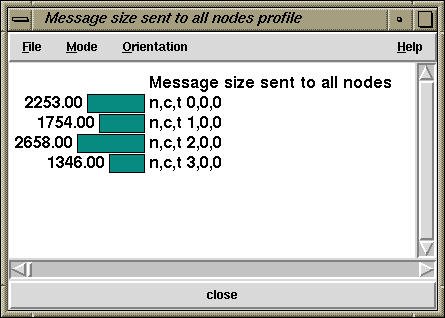
TAU's older profile browser "racy" also shows user defined events. In this case, we see the message communication information. The sizes of messages sent from each node are shown in the window above.
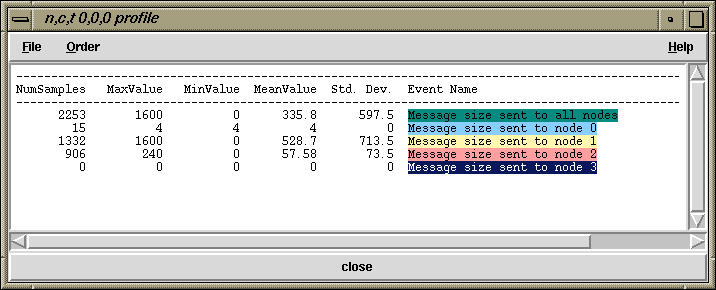
By clicking on a particular node (node 0 in the figure above), we see the message sizes of messages sent to all nodes and to specific nodes. TAU's user defined events can be used for tracking any application-level entity.
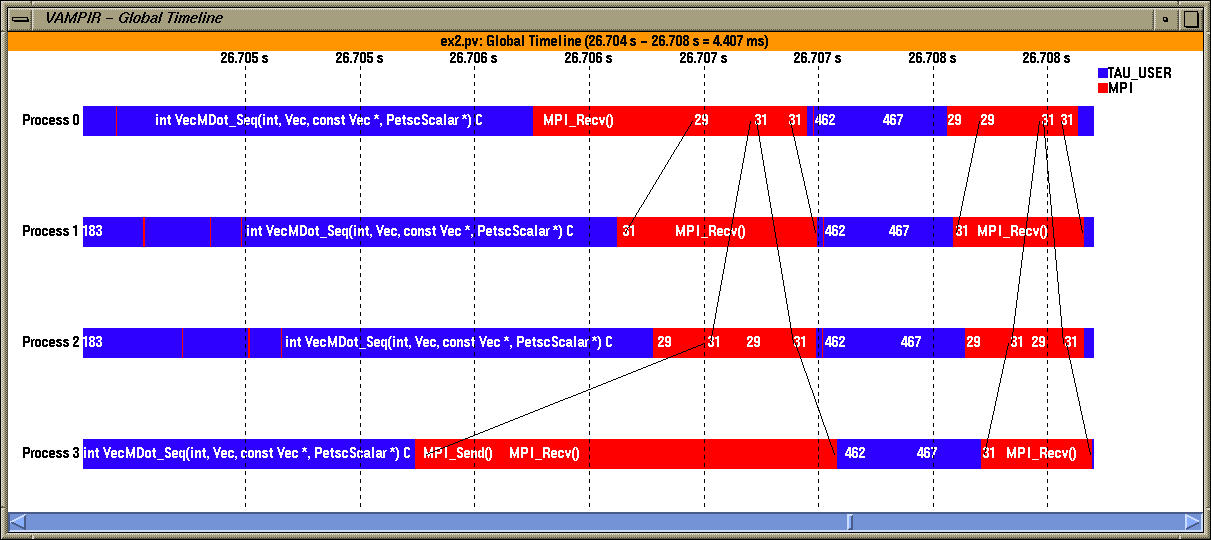
In the above figure, we see a timeline display. Inter process communication is also seen as line segments. Vampir allows the user to zoom into a segment of the trace to examine the events on each node.
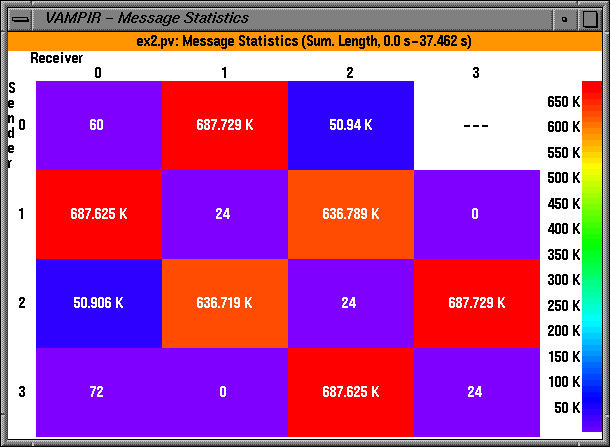
The above figure shows the communication matrix in Vampir. The extent of inter-process message communication is seen here.
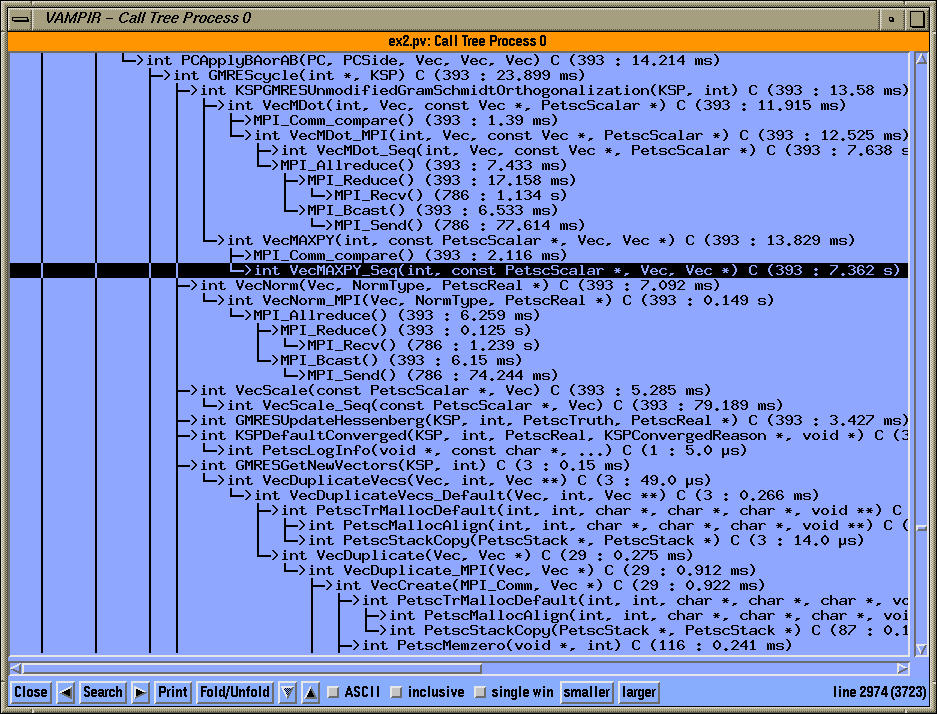
Tracing also preserves the dynamic calltree of a process. The calltree view on node 0 shows the time spent in VecMAXPY_Seq (7.3 secs), the number of times the routine was called (393) and the calling order.