 PETSc
PETSc
PETSc
PETSc
% mpirun -np 4 ex19 -da_grid_x 56 -da_grid_y 56These parameters execute the problem for roughly one minute. PETSc v 2.1.3 is configured with BOPT=O and TAU is configured with four different measurement options. These are:
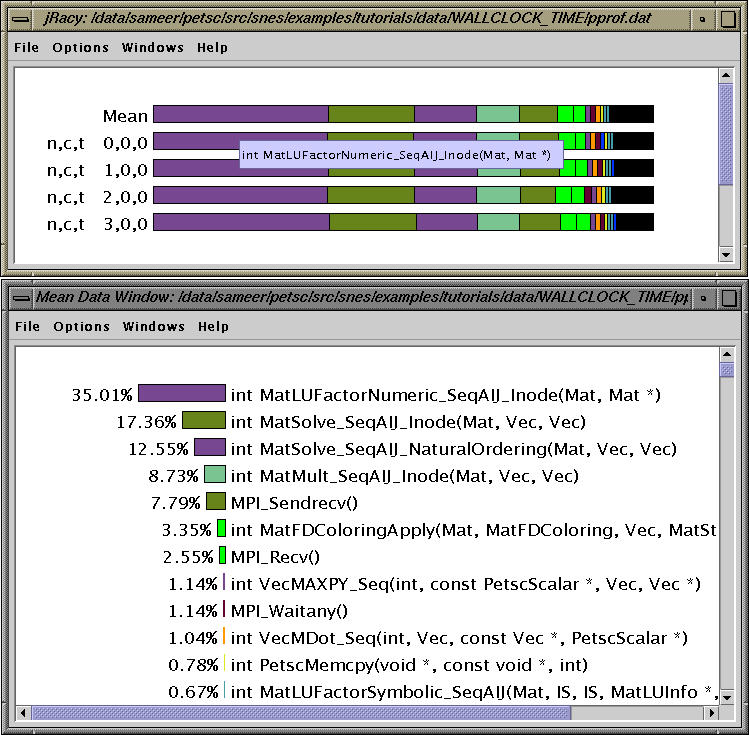
The above jracy display shows that the application behaves in a regular manner on all four nodes. By clicking on the mean histogram we get the mean window above. Here, we see that about 35% of exclusive time is spent executing the routine MatLUFactorNumeric_SeqAIJ_Inode.
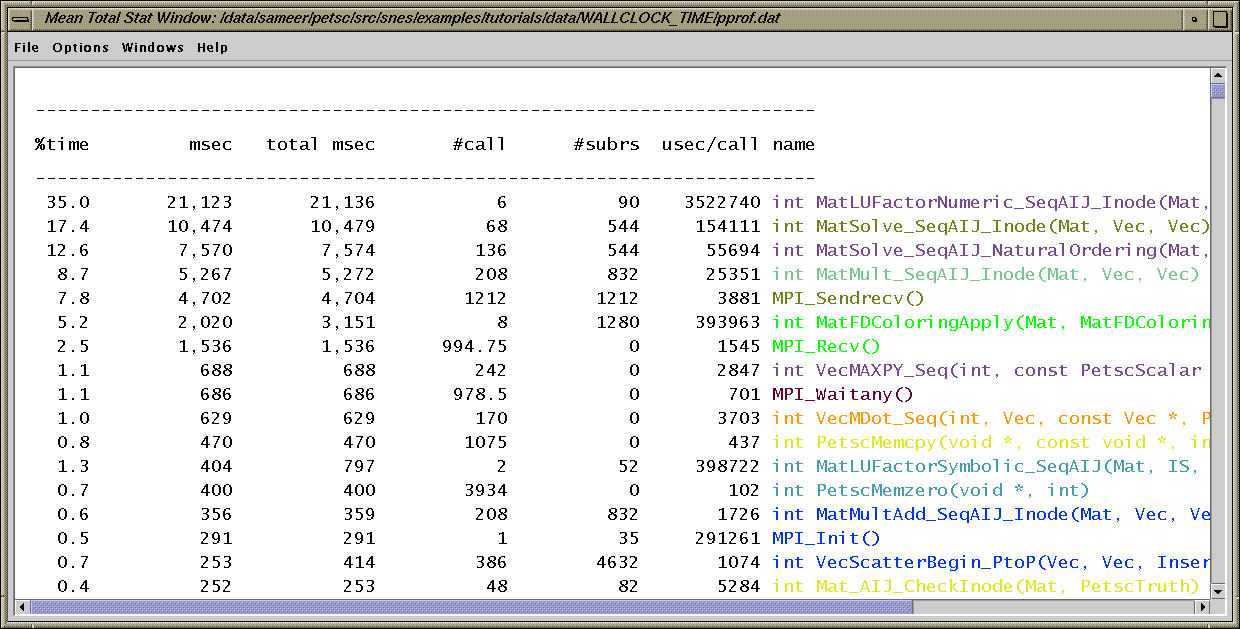
By clicking the middle mouse button over "mean" in the main racy window, we see the average text profile over all nodes. The routines can be sorted in different ways. Here, the routines are sorted by the exclusive time.
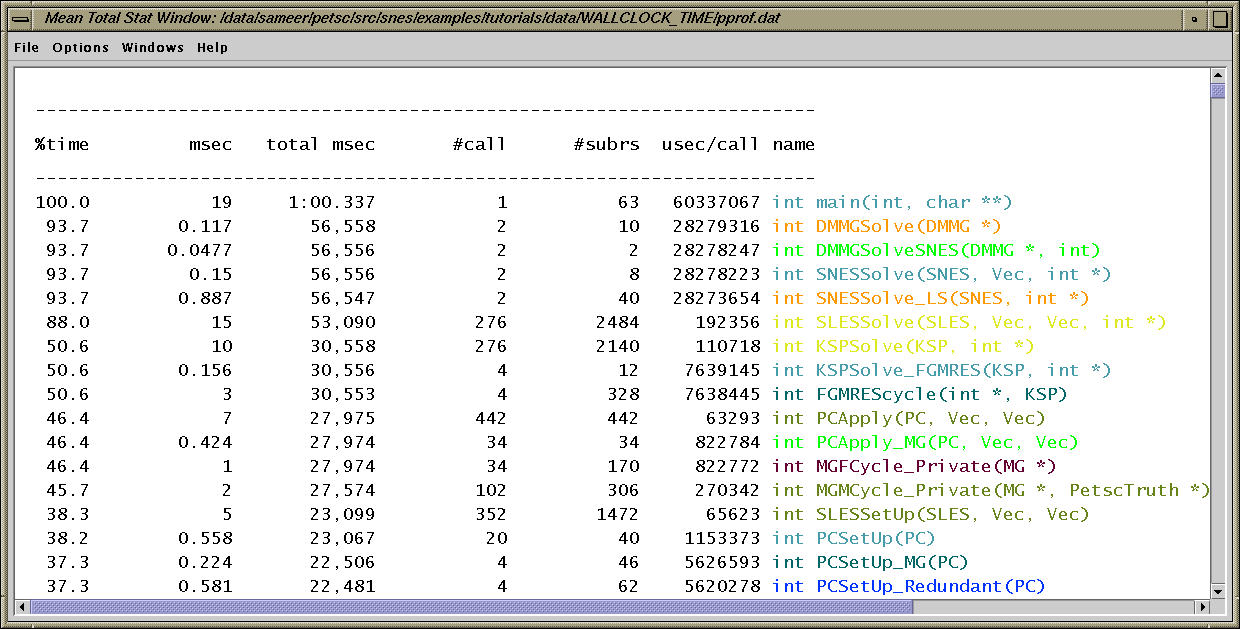 The data above is sorted by inclusive time.
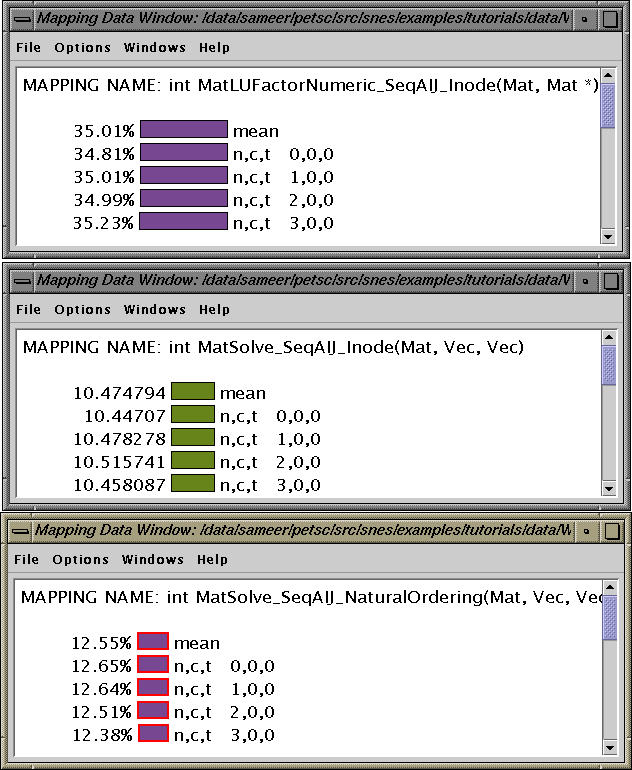
Clicking on the routine names or colors shows the breakdown of the routine over all nodes. The inclusive or exclusive time spent in the routine can be displayed in microseconds (msecs or secs) or as a percentage of the total time on that node. The routine MatSolve_SeqAIJ_Inode takes around 10.4 seconds exclusive time (the program takes 1 minute to execute).
The complete profile file is available here.
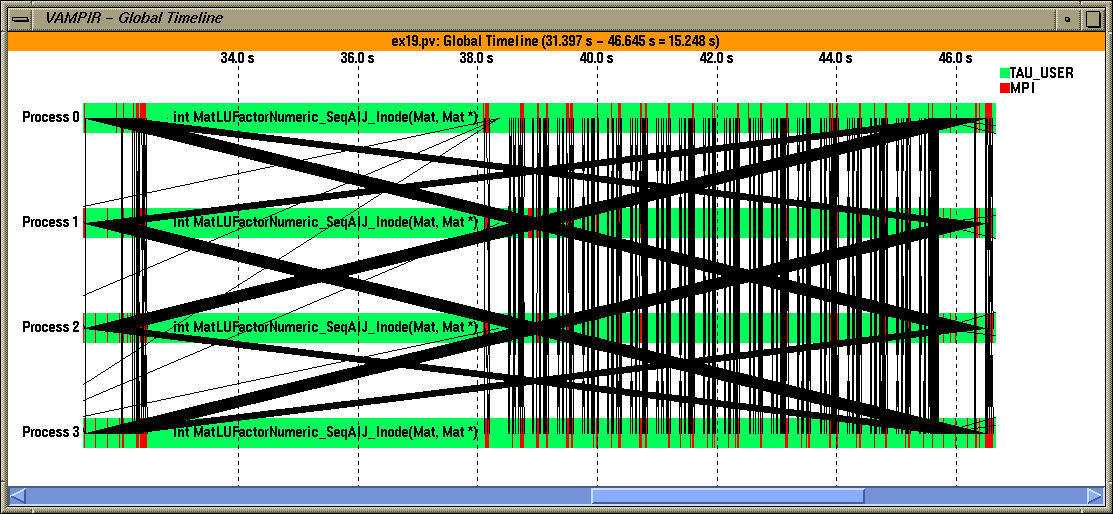
In the above figure, we see a timeline display. Inter process communication is also seen as line segments. Vampir allows the user to zoom into a segment of the trace to examine the events on each node.
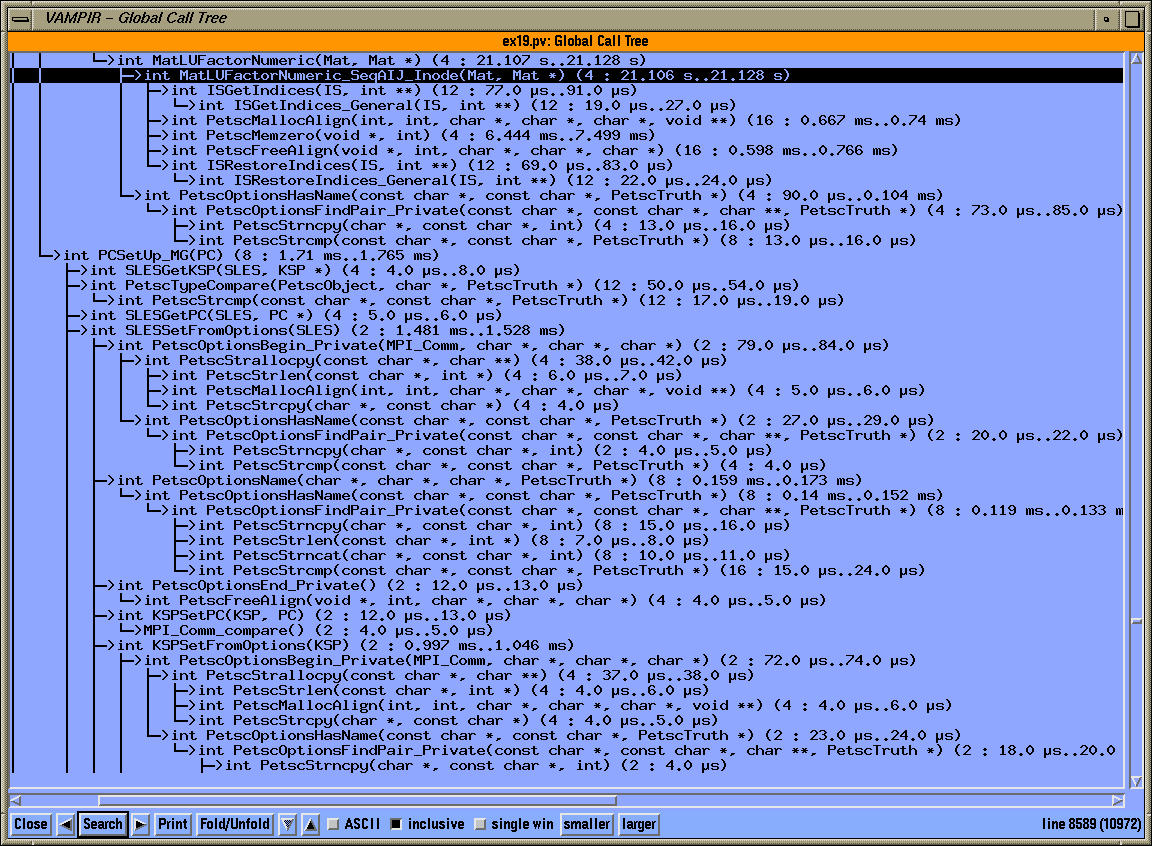
Tracing also preserves the dynamic calltree of a process. The global call tree view shows that the routine MatLUFactorNumeric_SeqAIJ_Inode is called 4 times and takes rougly 21 seconds to execute along the given calling path.
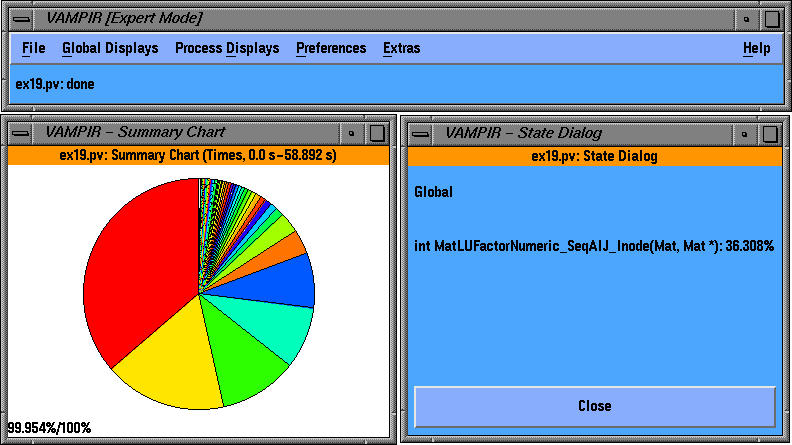
The global activity display above shows the relative distribution of time among the different routines.
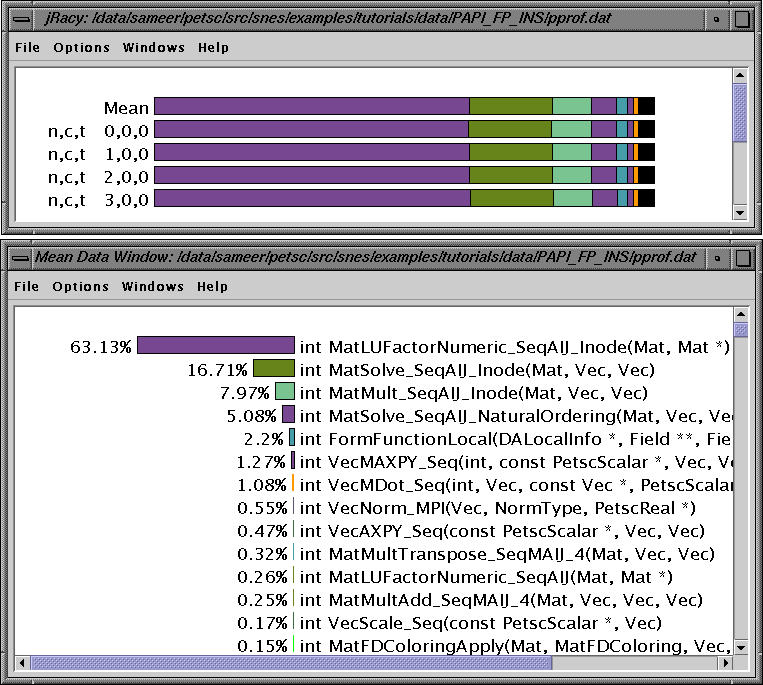
The above profile shows that the routine MatLuFactorNumeric_SeqAIJ_Inode accounts for roughly 63% of floating point instructions executed by the program.
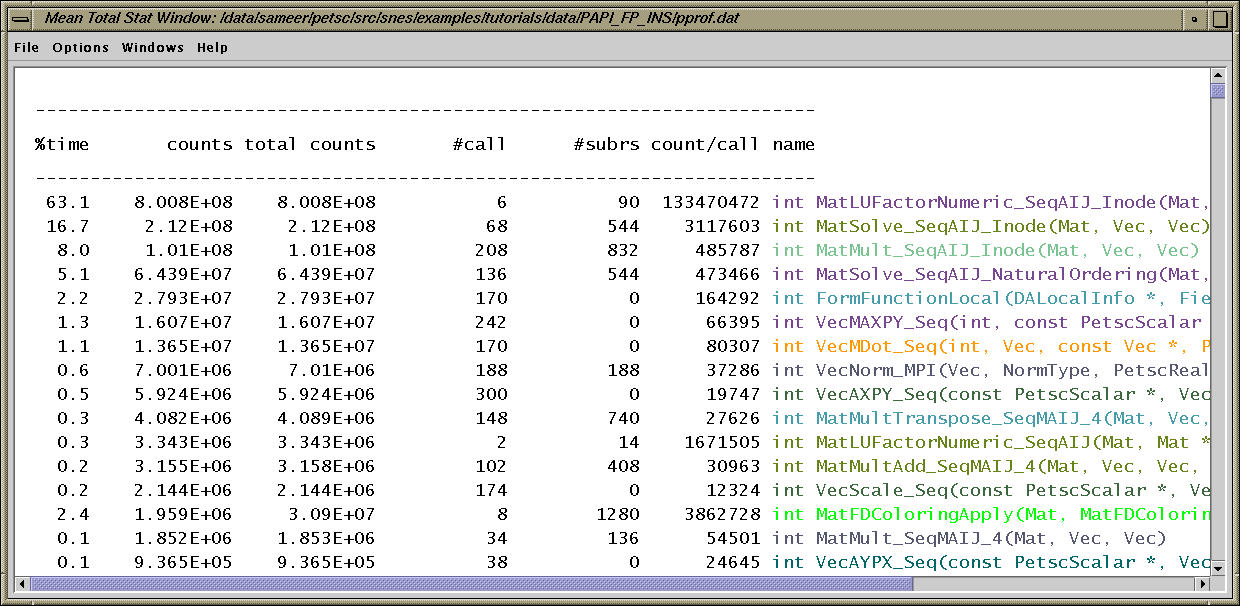
The mean profile sorted by exclusive counts is shown above.
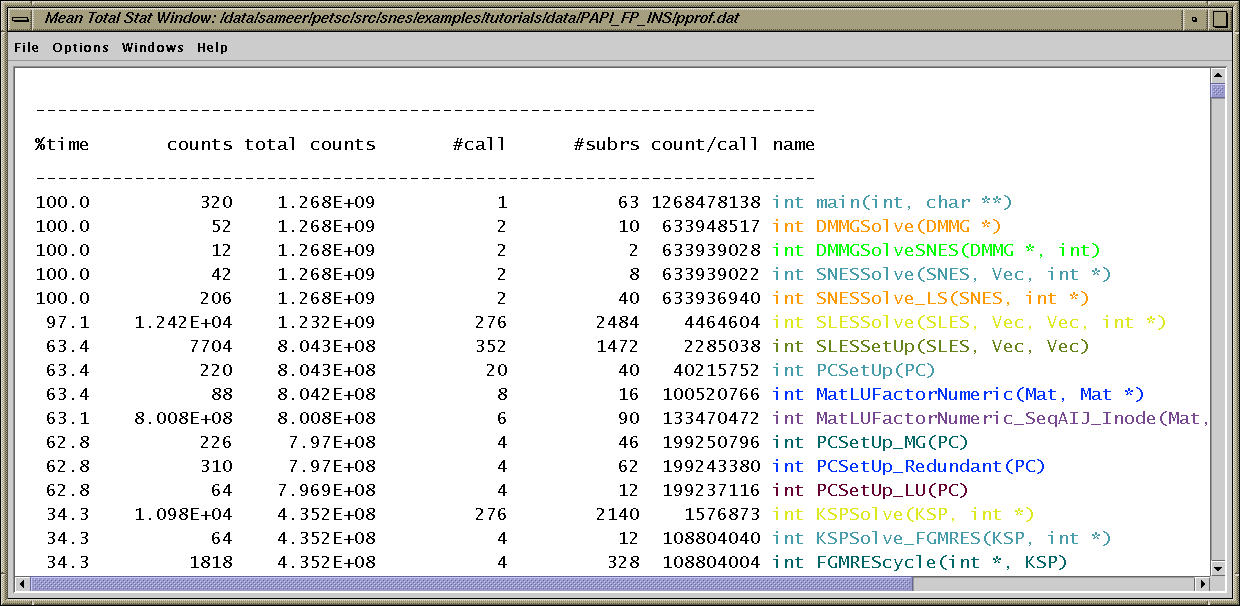 The same profile sorted by inclusive counts.
The pprof output is available here.
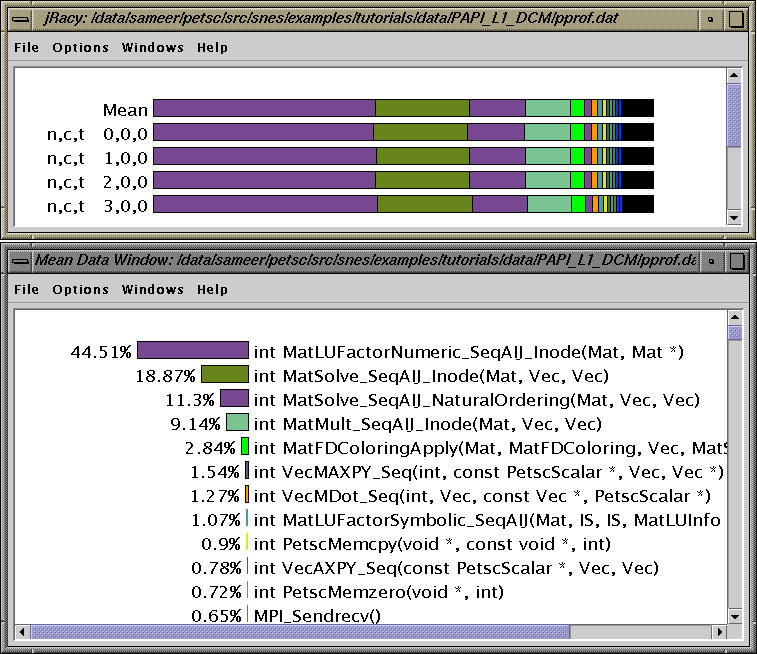
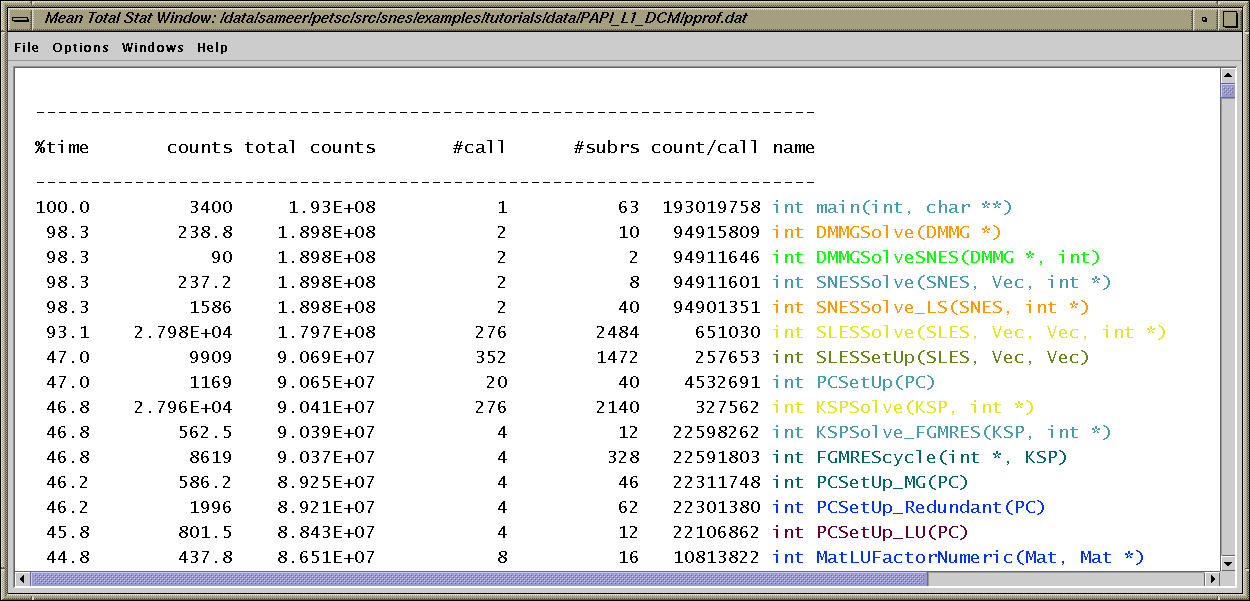
Here, we see the profile of ex19 with respect to Level 1 data cache misses. The routine MatLUFactorNumeric_SeqAIJ_Inode accounts for 44.51% of L1 data cache misses.
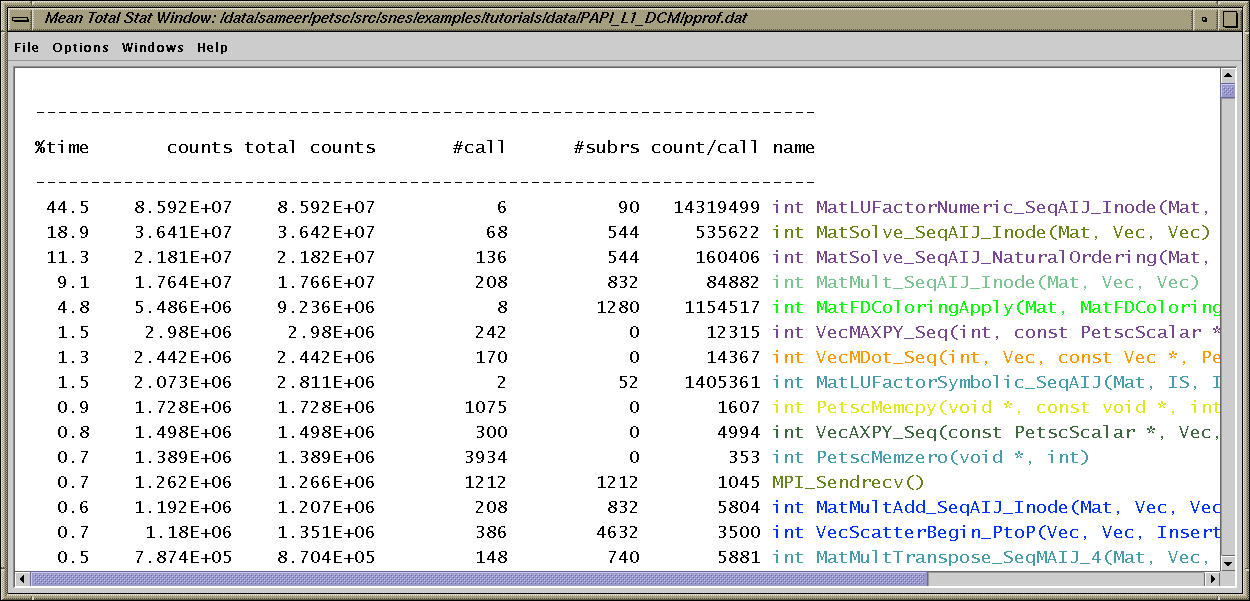
The mean profile sorted by exclusive counts is shown above.
 The same profile sorted by inclusive counts.
The pprof output is available here.
Selective instrumentation capabilities of TAU (tau_reduce) were used to eliminate instrumentation in three routines (described here) based on factors such as execution frequency and time spent in the routine (described here).
TAU and PAPI provide an integrated performance evaluation environment for PETSc users.
PETSc's next version (after 2.1.3) will feature native support for the TAU performance system.
For any assistance with PETSc and TAU, please contact <tau-team@cs.uoregon.edu>.