% make MACH=SP2
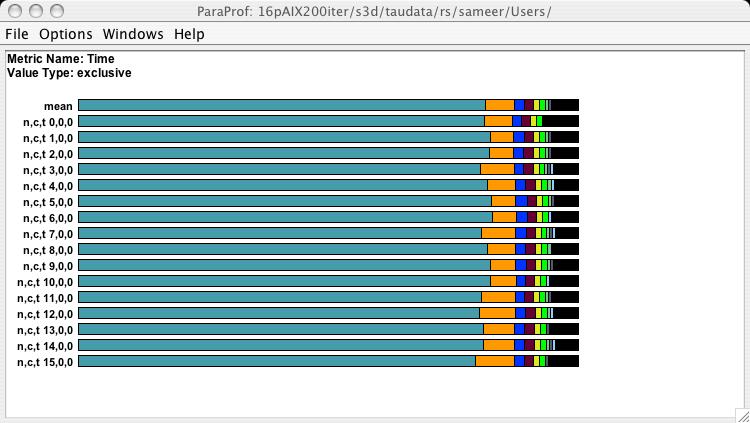
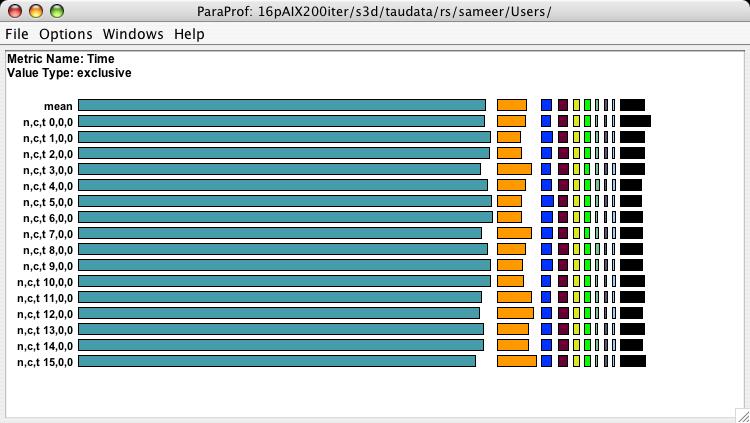
By clicking on mean, we see the mean exclusive profile of the application across all 16 tasks.
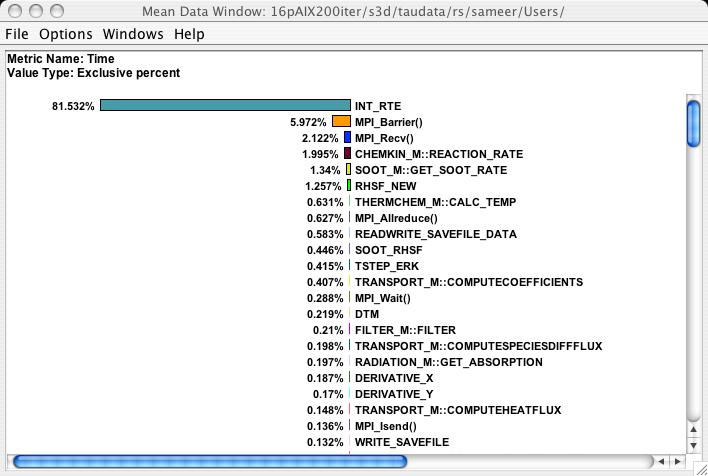
The application spends over 80% of its time in the INT_RTE routine.
To see the detailed text profile of this application, we right click on mean in the main window to show the mean text window.
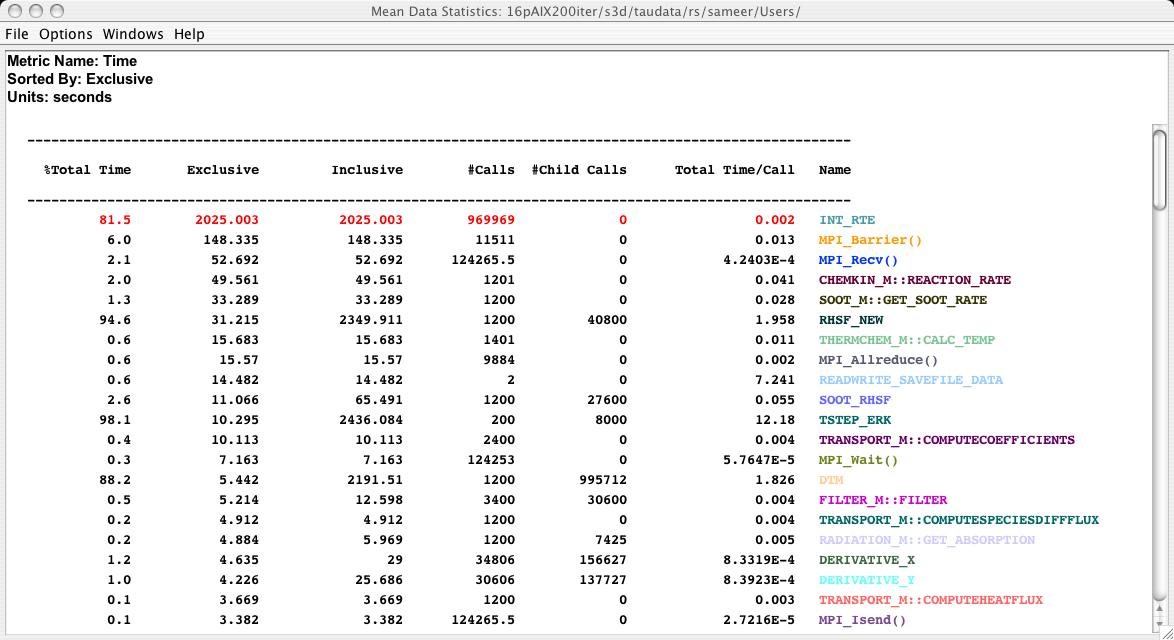
Here we can see that INT_RTE is called 969969 times and it does not invoke any other instrumented routine.
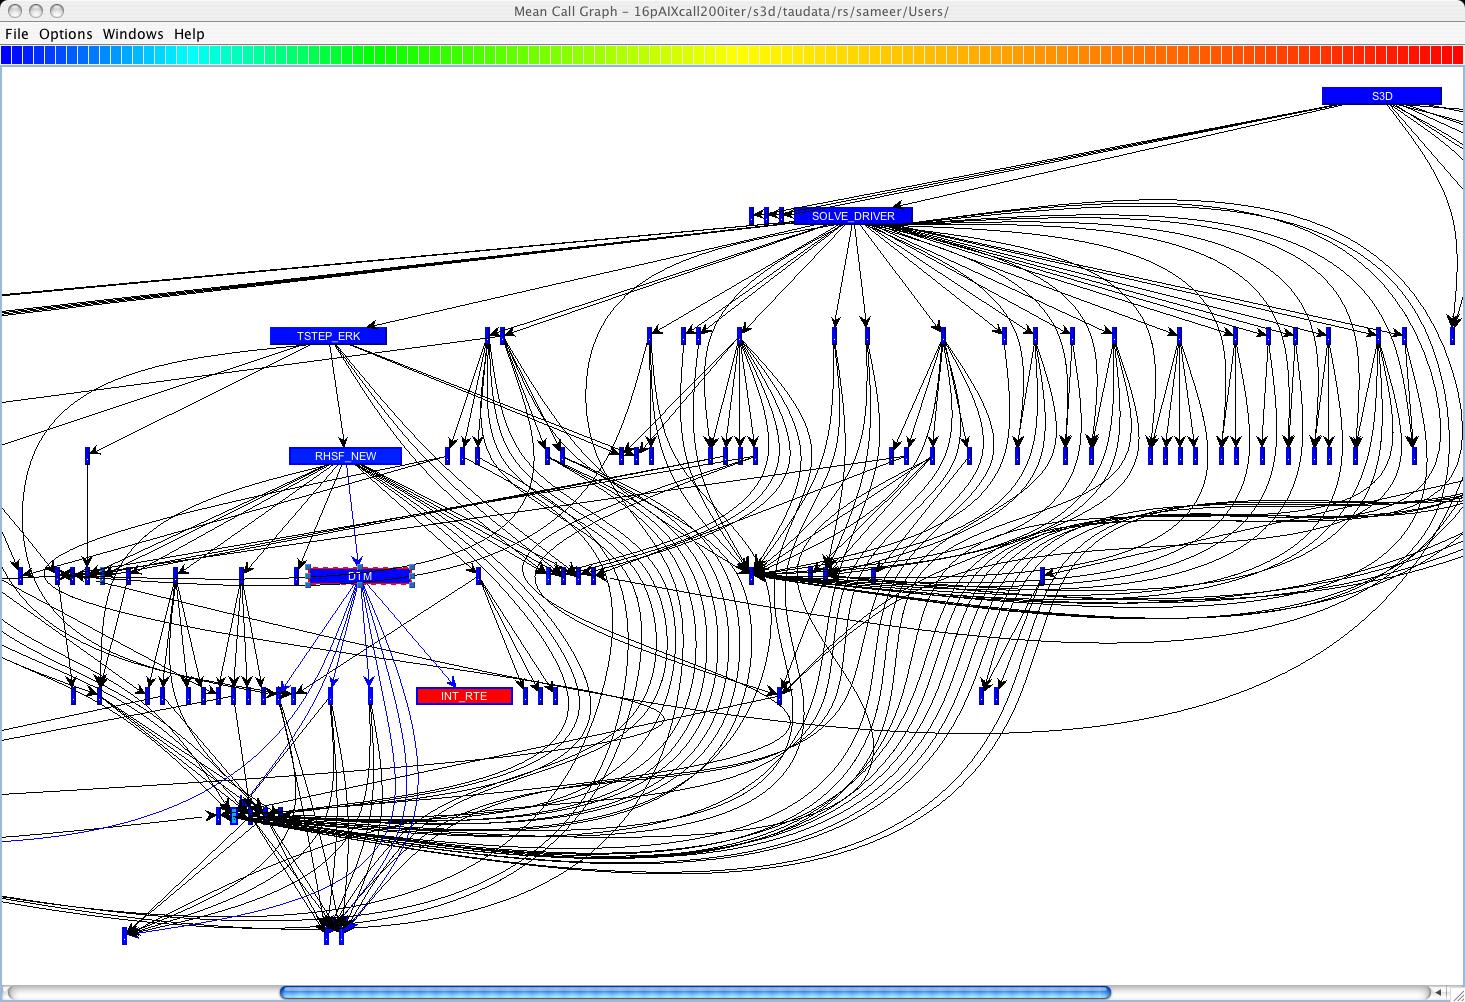
In this callgraph display, we see the sequence of events that called INT_RTE. The width of each node in this callgraph is proportional to the inclusive time spent in that routine while the color represents the exclusive time (blue is low, red is high).
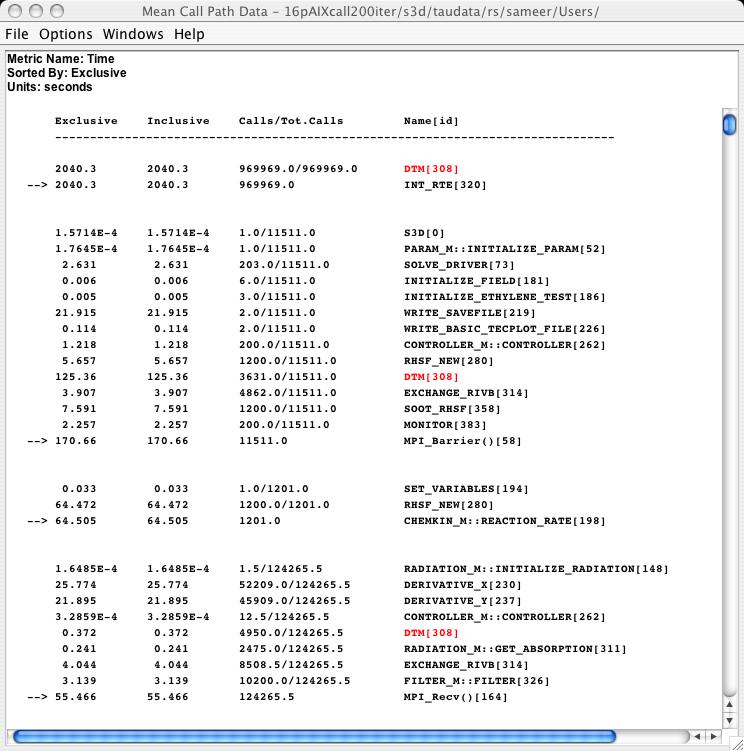
Here, we see the callpath thread relations view. In this view, all immediate parents of a routine (shown by an arrow) are shown above the given routine and all immediate children are below the routine. We see that the routine INT_RTE had only one parent - DTM. We also see that of the 170 seconds spent in the routine MPI_Barrier, DTM accounted for 125 seconds and DERIVATIVE_X and DERIVATIVE_Y accounted for 25 and 21 seconds respectively, of the 55 seconds spent in MPI_Recv.
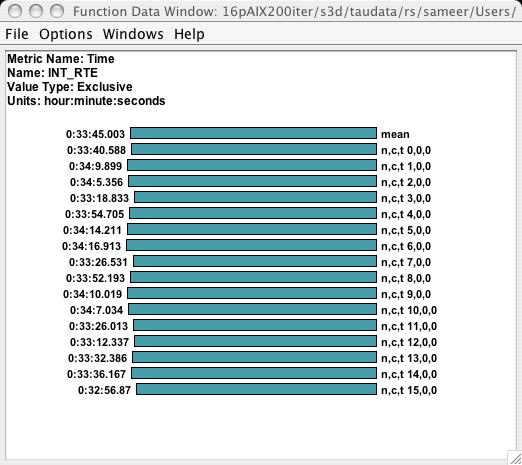
We see that 33 minutes were spent in INT_RTE routine.
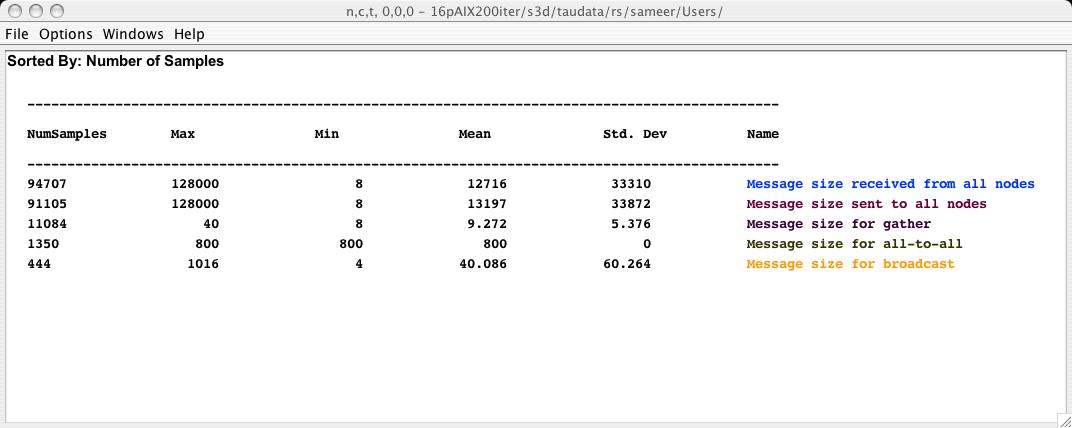
TAU also keeps track of communication statistics. These are shown below in the user defined event display which is obtained by clicking the right mouse button on the node labels in the main paraprof window.
TAU's main window display histograms that are stacked together or drawn separately. This allows us to easily compare the performance of a given routine across all nodes.
TAU allows you to connect to a performance database (PerfDMF) and upload or download an experiment. You can store application level metadata in the fields provided.
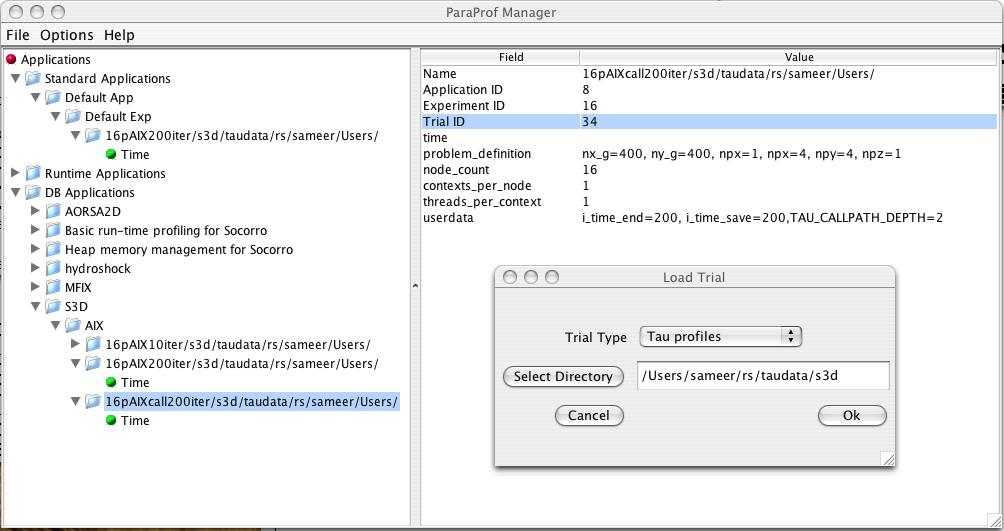
This allows us to compare trials and perform datamining operations.