TAU and SAGE

Introduction
TAU currently uses hand-instrumentation for SAGE. We plan to use PDT for source-to-source translation based instrumentation of SAGE F90 source code. TAU's MPI wrapper library level instrumentation is used to gather information pertaining to the MPI library.
Vampir
TAU can generate profiles and event-traces. Event-traces can be visualized using Vampir (Pallas GmbH), a commercial trace visualization tool.
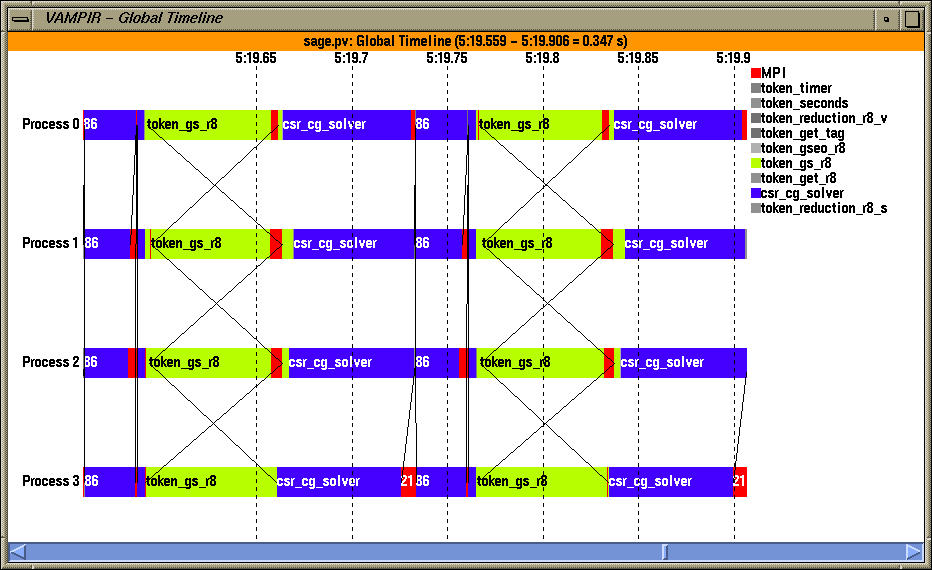
The timeline display highlights different events that take place in processes along a global timeline.
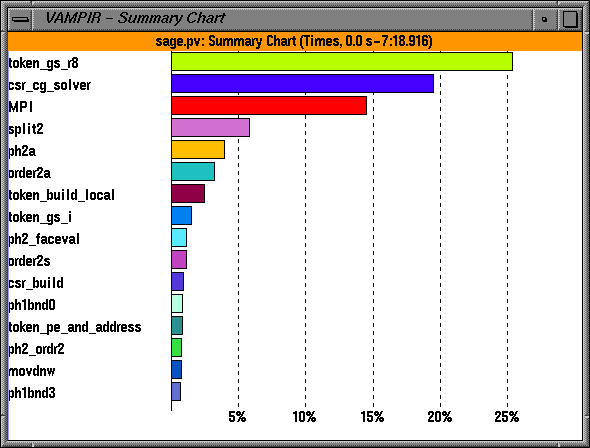
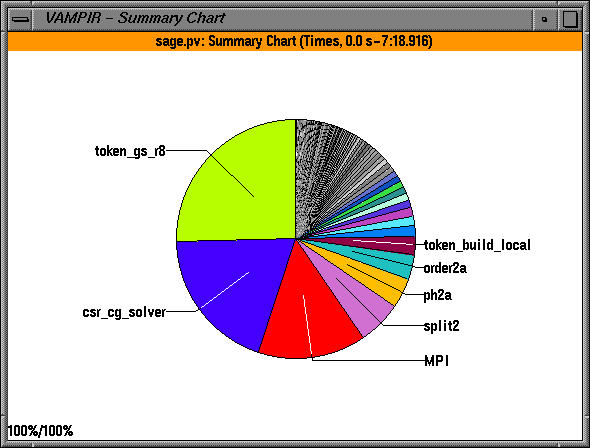
The global summary chart shows the breakdown of time for all processes.
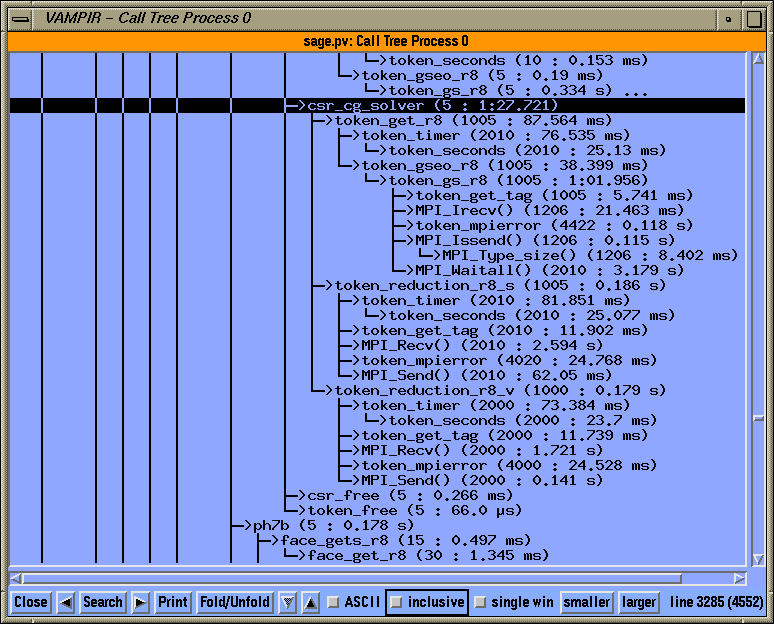
The dynamic calltree on node 0 shows the exclusive time spent in each routine along with the number of times the routine was invoked.
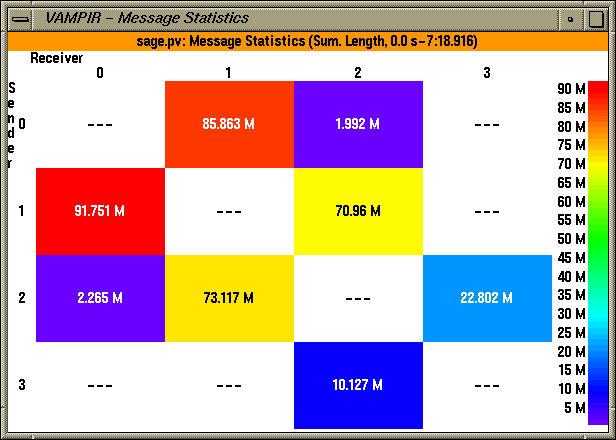
The communication matrix shows the volume of inter-process message communication in the form of a matrix comprised of senders and receivers.
Profiles for multi-processor run using MPI
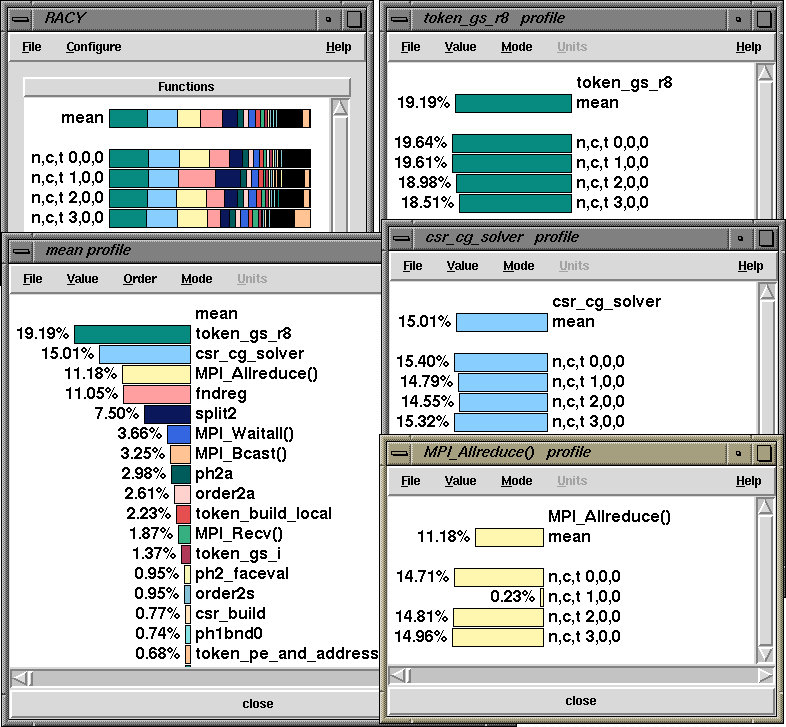
The profile browser Racy displays performance data for a 4 processor run of SAGE. In the top left window, we see individual color-coded node profiles as well as the mean profile. Clicking on "mean" gives us the mean node profile (bottom left window). It shows the breakdown of exclusive time in all nodes. Clicking on an individual routine name brings up the routine windows (right) that highlight the exclusive or inclusive time (percentage or value) spent in each node.
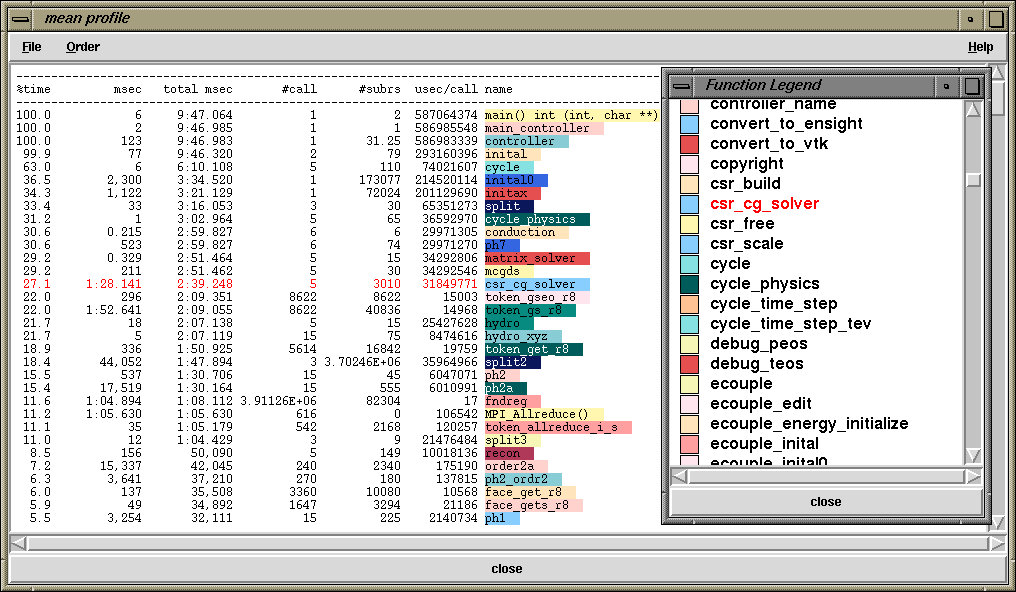
The text window shows the routines sorted by their mean inclusive time. The function legend is on the right.
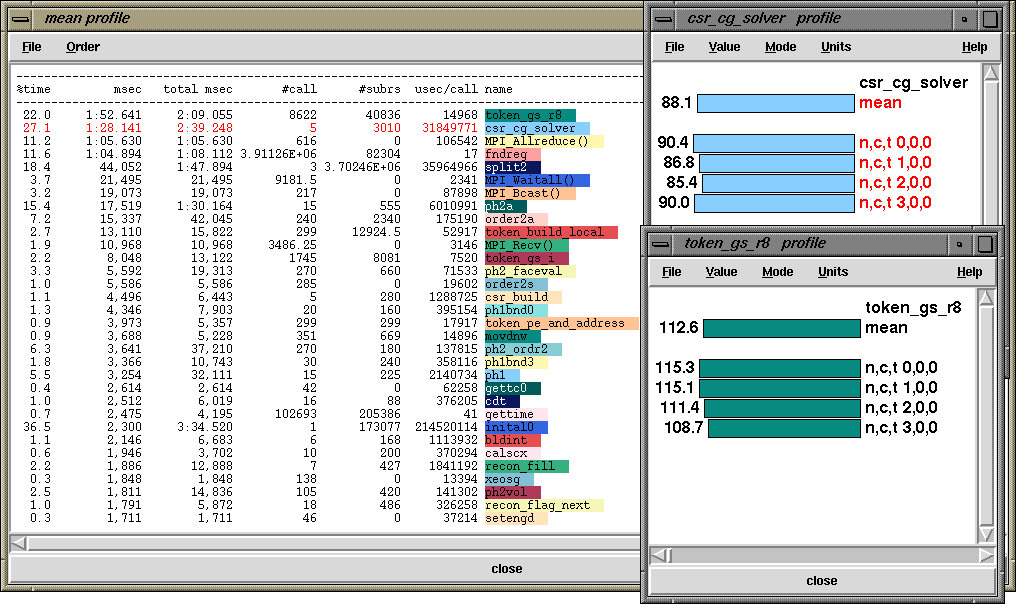
Choosing the exclusive time in the "Order" menu reorders the routines (sorting them based on their exclusive time) for all routines. Routines "csr_cg_solver" and "token_gs_r8" are shown on the right. These windows display the exclusive time in seconds on all nodes for the routines.
Profiles for a single processor run
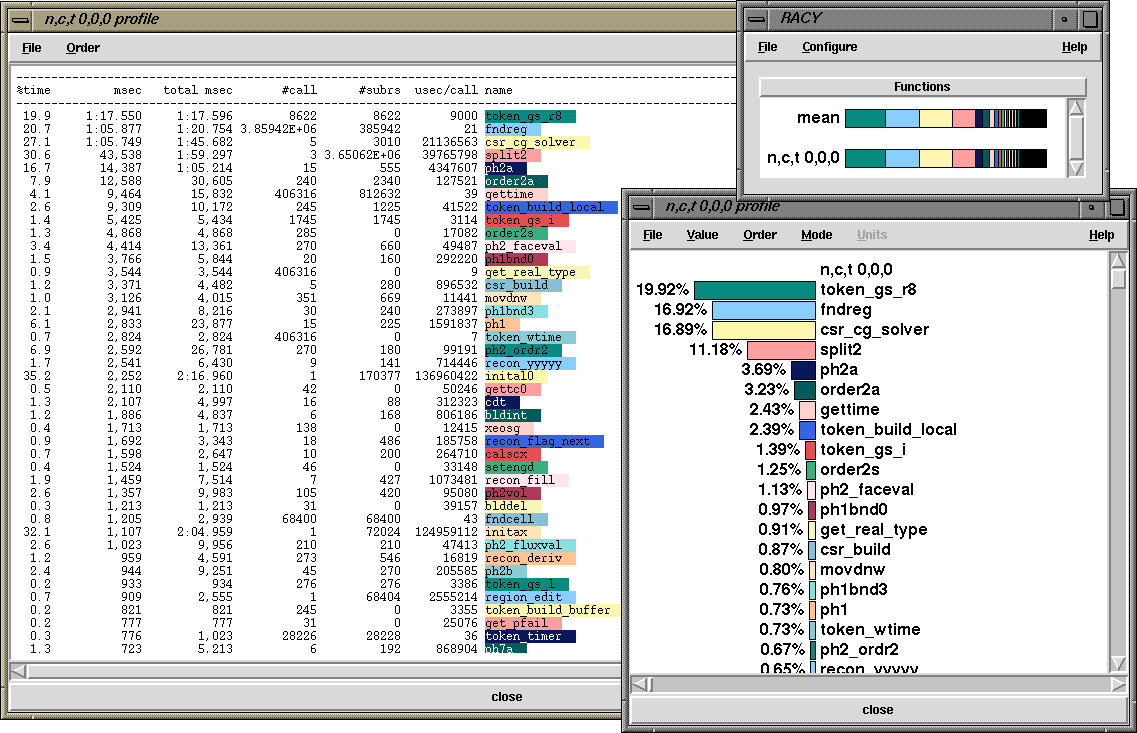 A one processor run shows the breakdown of time in SAGE.