
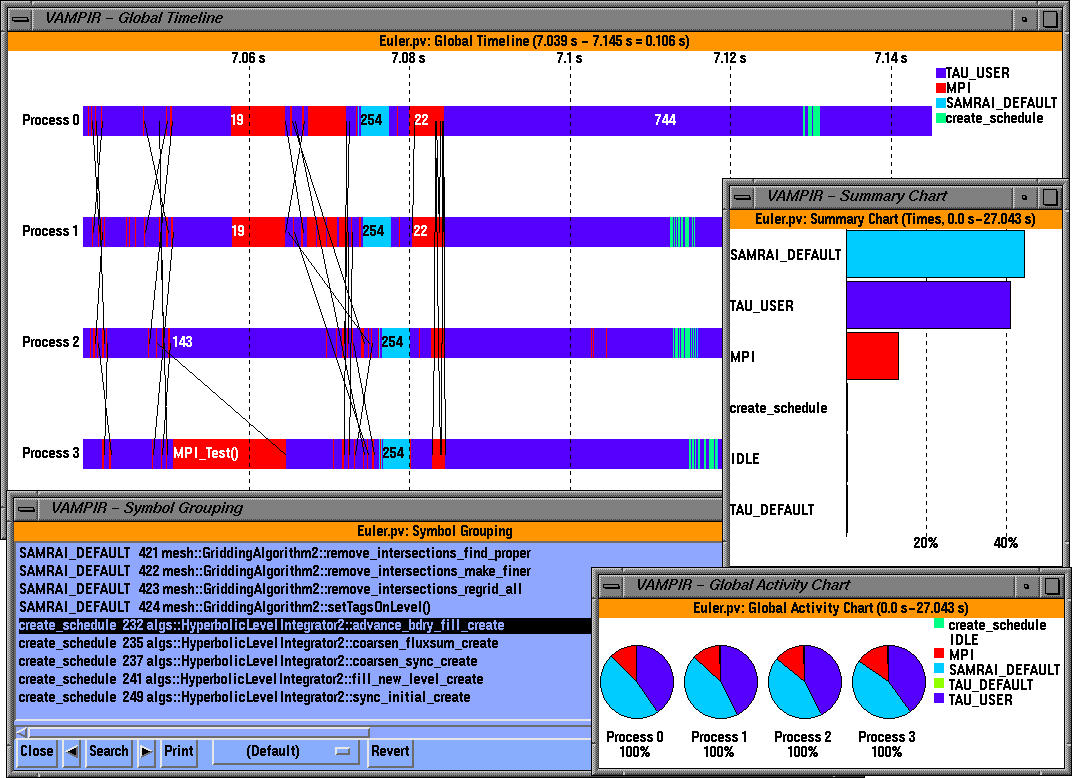
This figure shows timers such as algs::HyperbolicLevelIntegrator2::advance_bdry_fill_create that belong to the group create_schedule.
Color coded groups are used to partition the performance data in logical groups.
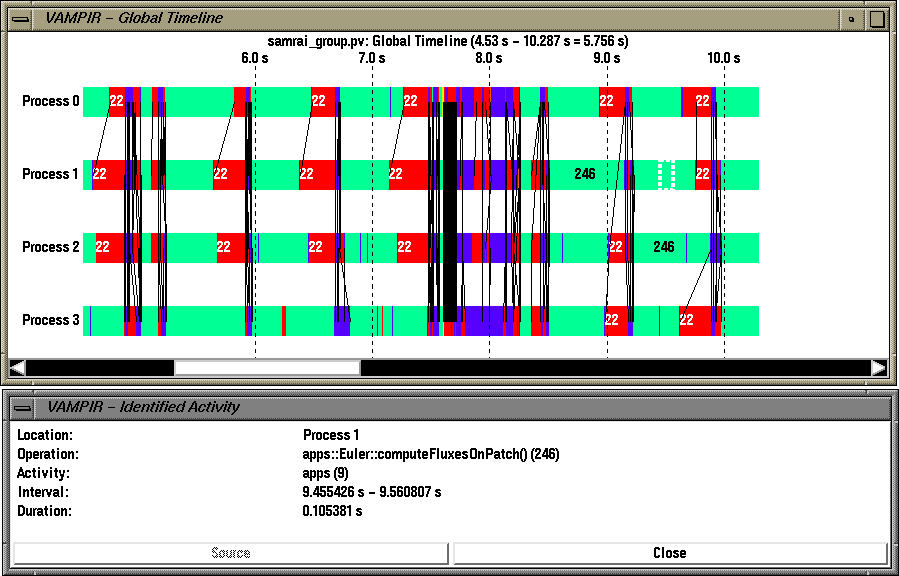
For example, in the timeline display above, "apps::Euler::computeFluxesOnPatch" timer belongs to group "apps".
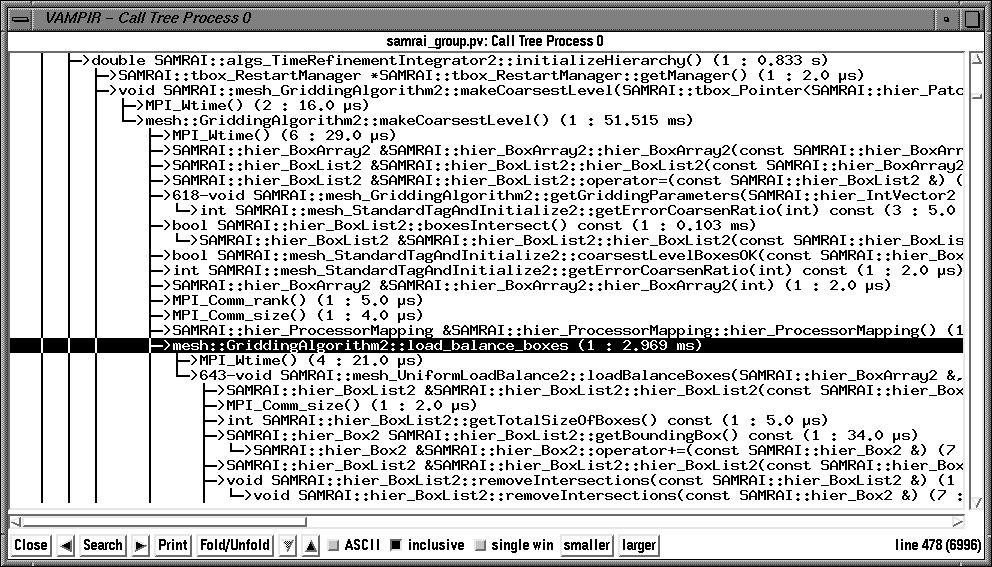
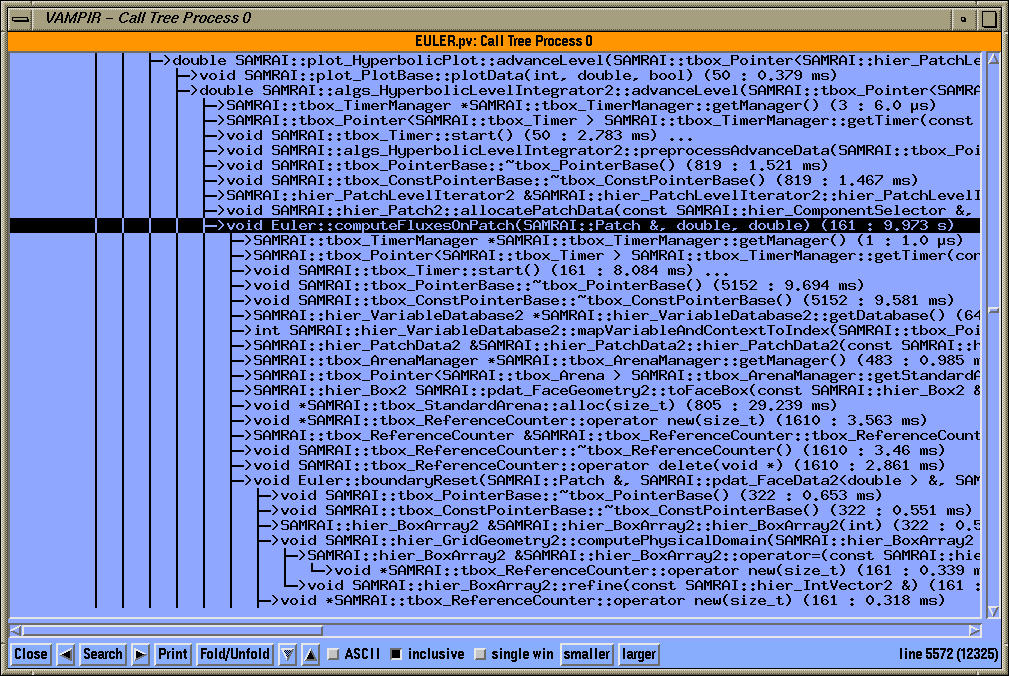
In the callstack display, we can see how SAMRAI timers ("mesh::GriddingAlgorithm2::load_balance_boxes" is highlighted) are seamlessly integrated with routine level instrumentation and MPI level instrumentation in all Vampir views.
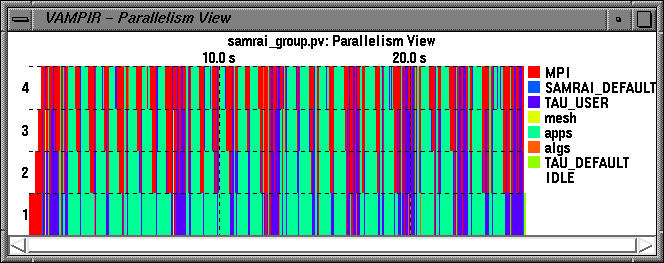
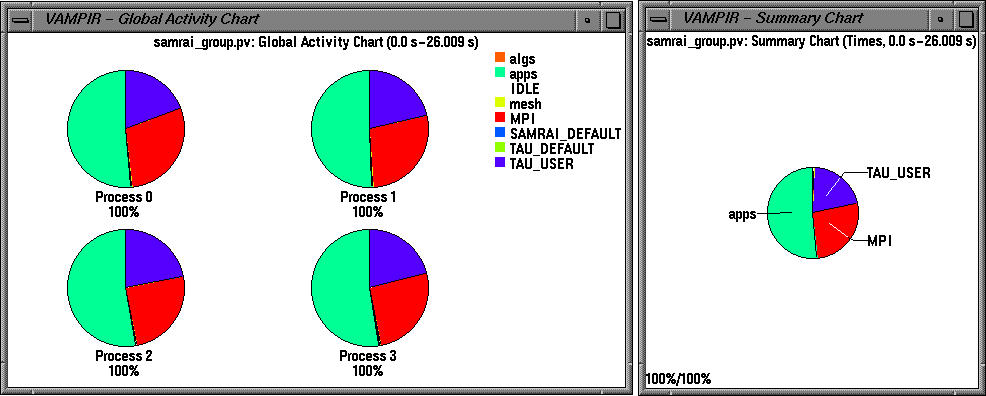
Parallelism View displays the number of processors that are concurrently participating in different groups of activities. SAMRAI timers belong to groups mesh, apps, and algs.
This grouping is useful to find the level of nesting associated with logical groups in the process timeline display.
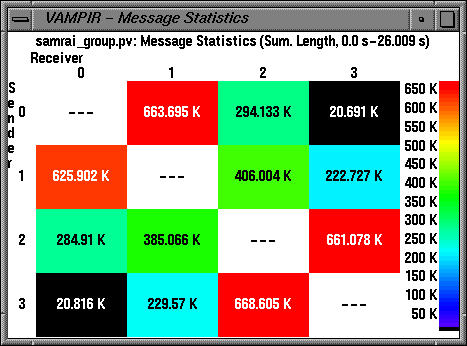
The extent of inter-process communication is highlighted by the communication matrix display.
To view this trace locally, download samrai_group.pv.gz trace file.
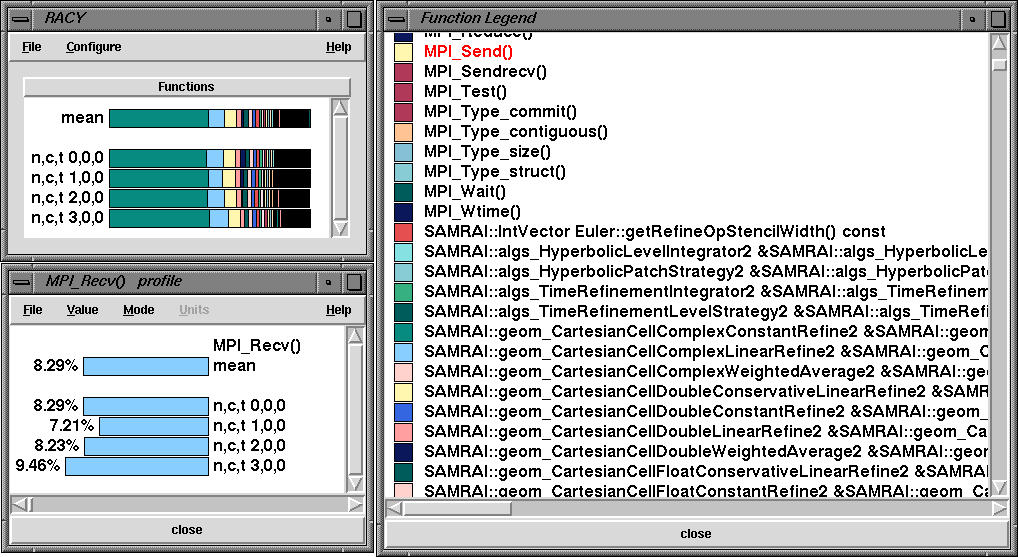
The above profile was generated for the SAMRAI Euler code on a quad Pentium III Xeon machine (mpirun -np 4 main2d sample_inputs/room-2d.input). Racy, TAU's profile browser shows the overall profile for the four nodes (corresponding to processes with MPI rank 0-3). The function legend window shows the SAMRAI routines. MPI_Recv routine takes about 8% of the total time as shown in the function window.
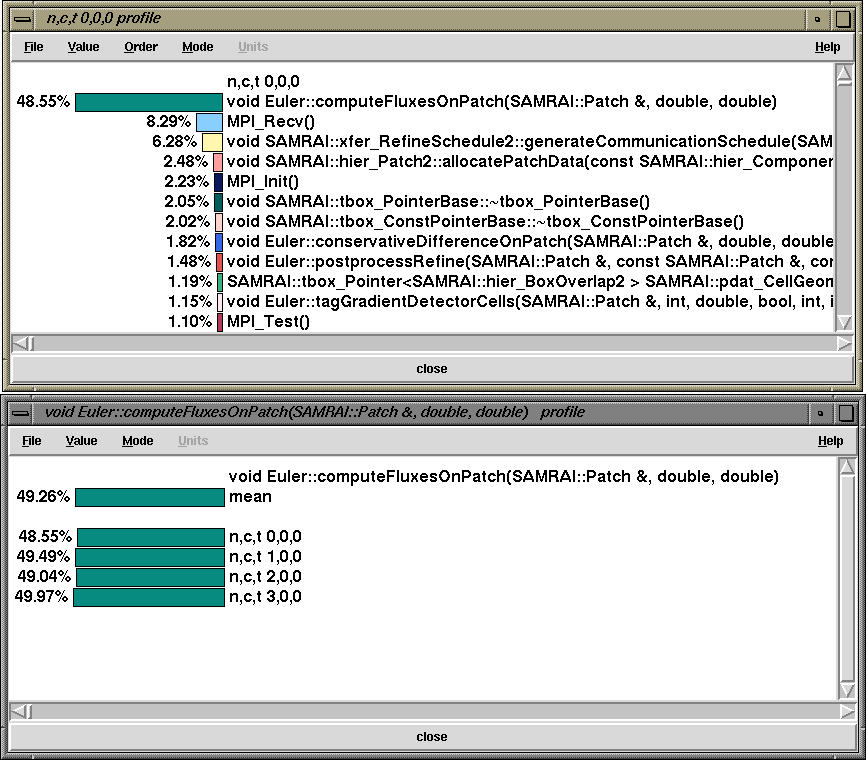
By clicking on the n,c,t 0,0,0 button in the main racy window, we get the node profile that shows the exclusive time spent in each routine on node 0. By clicking on the routine we see that Euler::computeFluxesOnPatch routine takes 49% exclusive time on all nodes.
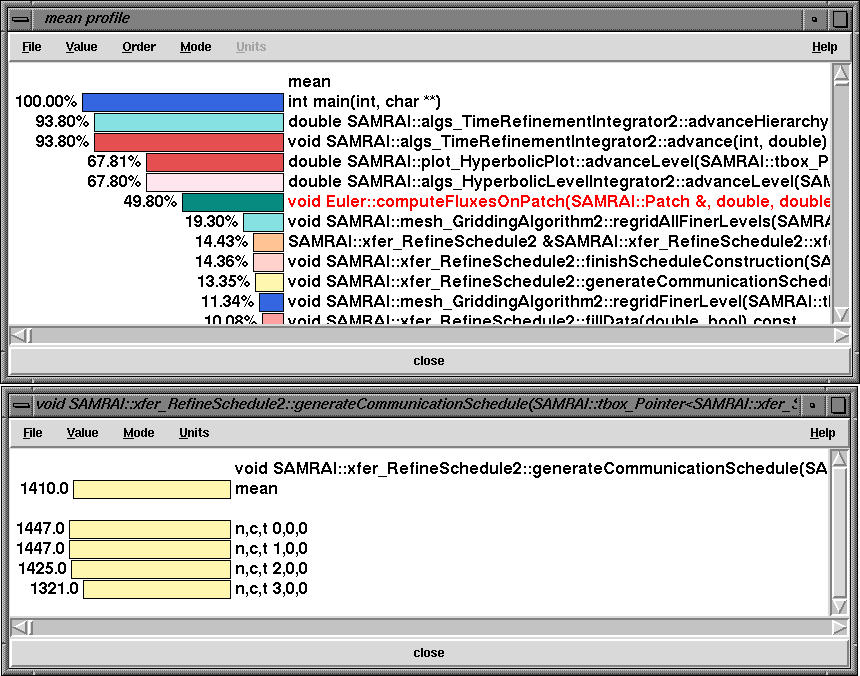
By choosing inclusive (total microseconds) instead of exclusive (microseconds) option in the Value menu, we see the inclusive time spent on all nodes in the mean profile window. Instead of percentages, by choosing value in the Mode menu and choosing milliseconds in the Units menu, we see that xfer_RefineSchedule2::generateCommunicationSchedule takes 1410 milliseconds averaged over all nodes.
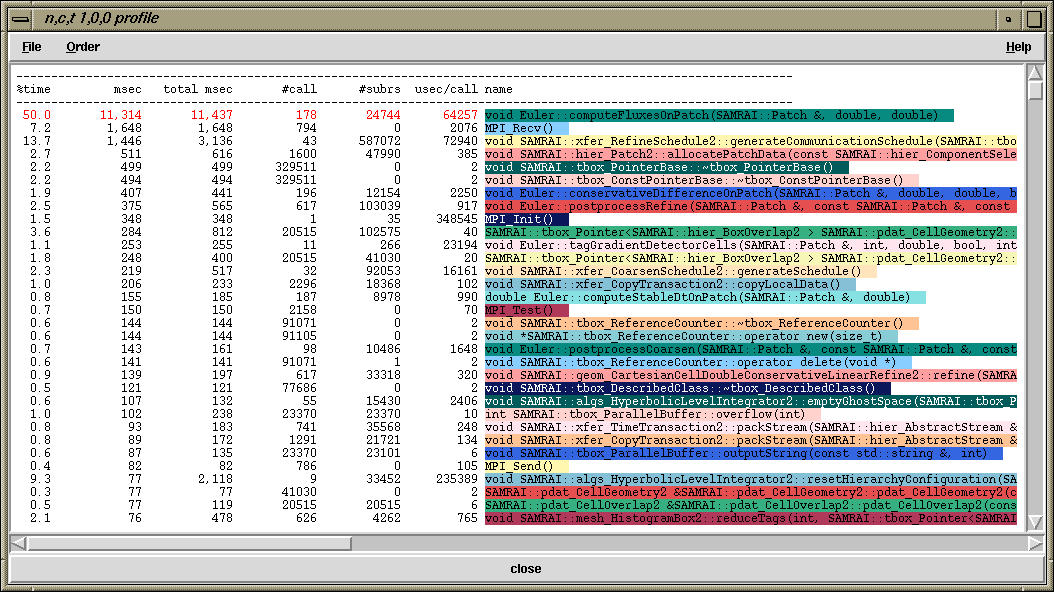
Clicking the middle mouse button on n,c,t 1,0,0 in the main racy window brings a text profile. It is a sorted list (which can be sorted by choosing the Order menu). It shows the exclusive, inclusive times as well as the number of times a function was called (calls) and the number of routine that it in turn called (subrs). It also shows the inclusive percentage and inclusive microseconds per call for each routine.
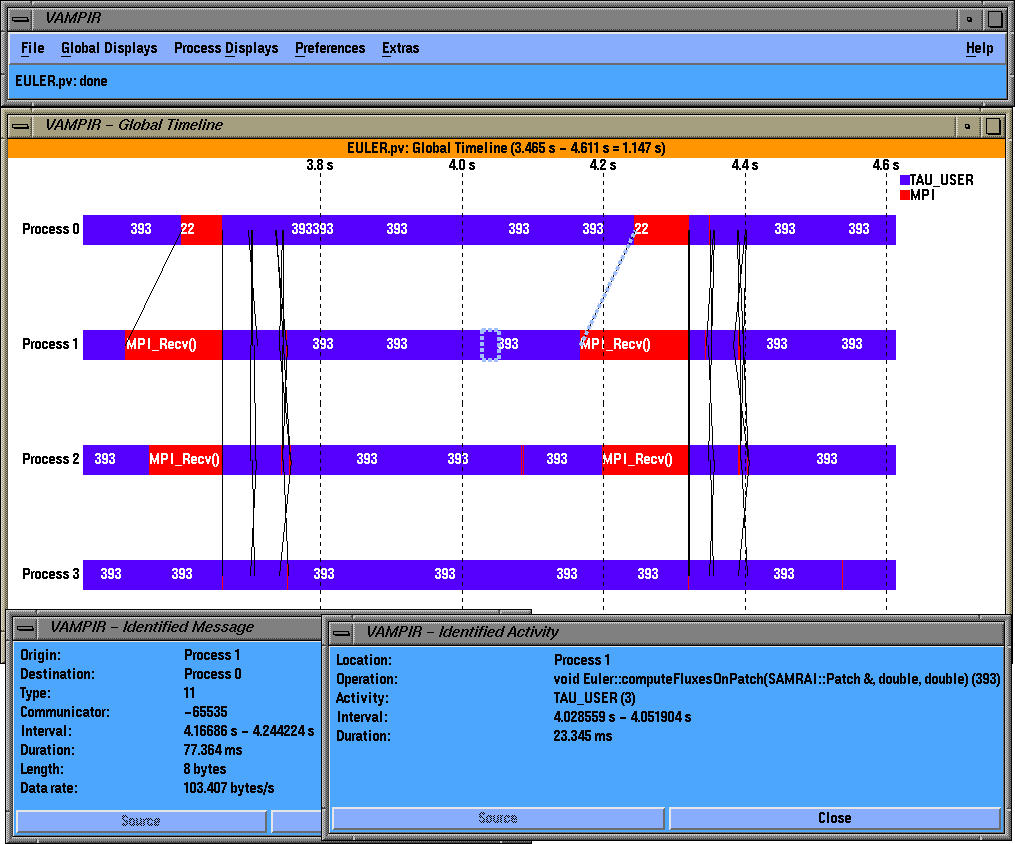
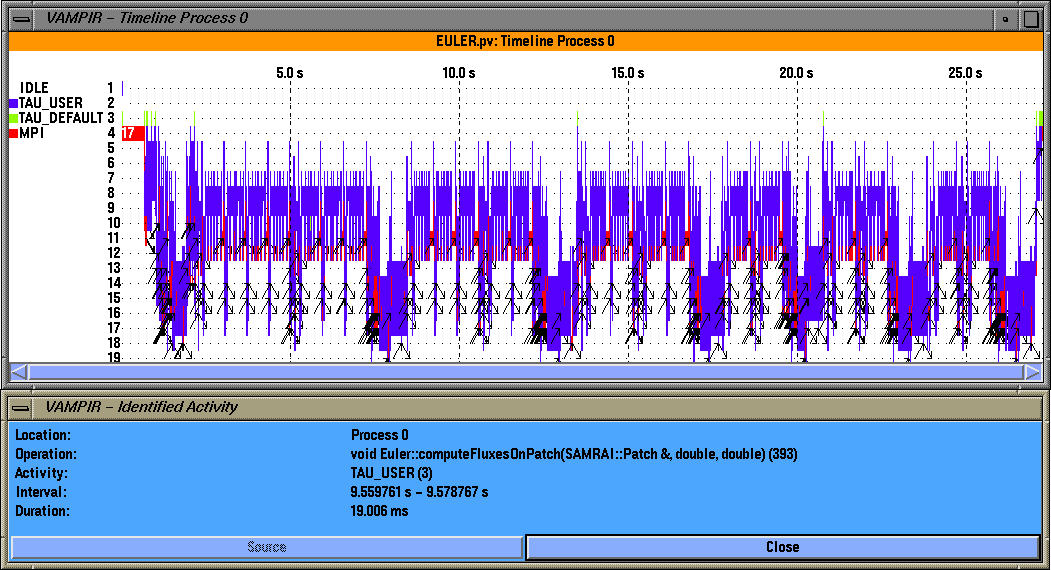
The main timeline view shows the temporal variation of performance data.
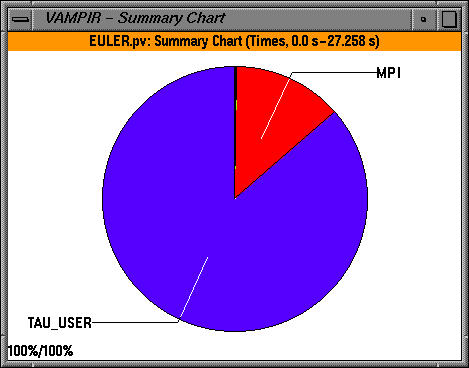
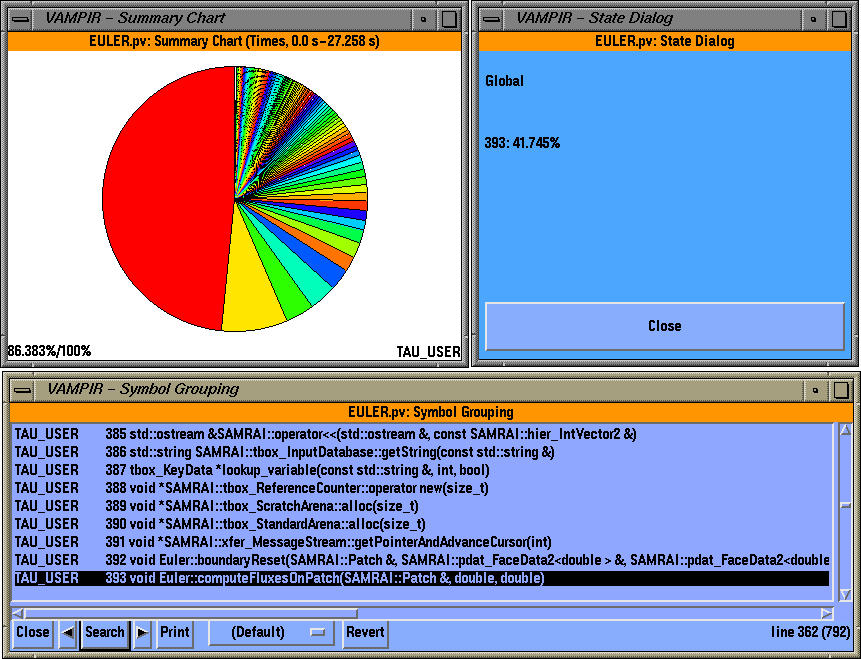
The summary chart shows the contribution of all MPI routines grouped together over all processes. We see that a significant portion of the time is spent in the TAU_USER group. To see all the symbols that make up the summary chart, we click on "All Symbols" display (right mouse button).
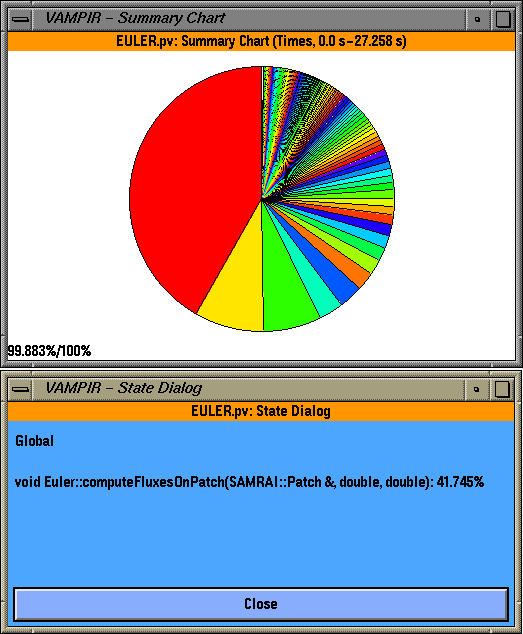
We see that one routine dominates the overall execution time (red color). By clicking on "identify state" (right mouse button) we see that it is "Euler::computeFluxesOnPatch" and it takes up 41.745% of the overall time. We can get see the breakdown of one group of routines (TAU_USER here) and identify the contribution of the routines to the total execution time as shown below.
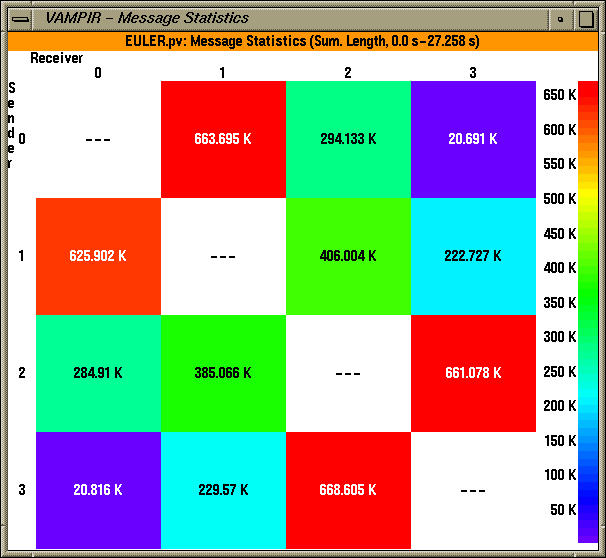
Other views include the Communication matrix view, that shows the extent of inter-process communication between processes (sender processes are along the y axis, receivers are along the x axis), as shown below.
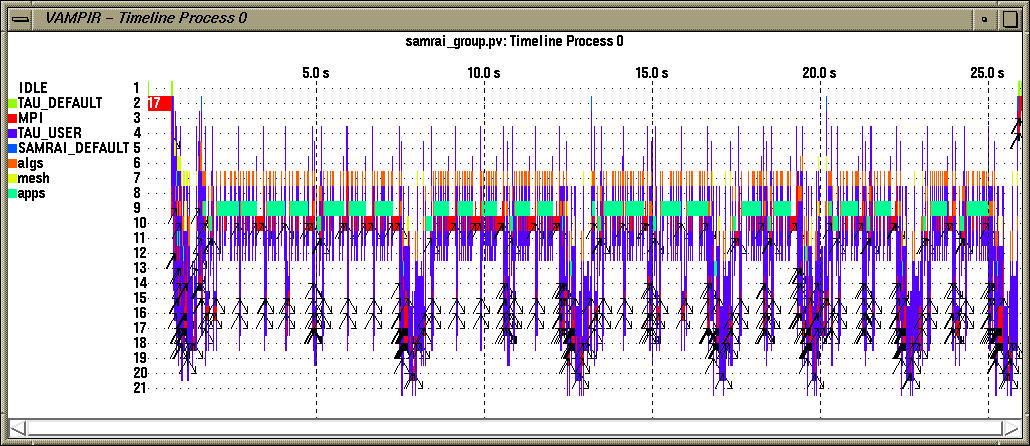
To see the level of nesting on a single process, we select the desired process (process 0 in this case) in the global timeline display and click on the "Timeline view" in the Process views menu in the main vampir window. In this view, inter-process communication events are shown by black arrows.