

options.timesteps = 400
options.maxLevel = 1
--ratio="1:4"  (command line option)
on a 20 processor Linux PIII cluster using nodes 11-30 on asap. The other options were:
>>> flow: executing 'mpirun -nolocal -np 20 -machinefile cube-000.nodes `which mpipython.exe`
./shock.py --nodes=20 --mask=default --solidScale=0.5 --ratio=1:4 --vizserver=localhost
--port=50000 --fluidScale=1.0 --exchange=mpi --model=cube.py --eos=PerfectGas --solid=adlib
--worker=true --fluid=arm3d --id=0 --program=./shock.py --node-list=11-30
TAU was configured with -LINUXTIMERS and -useropt=-O2 with gcc 3.0.
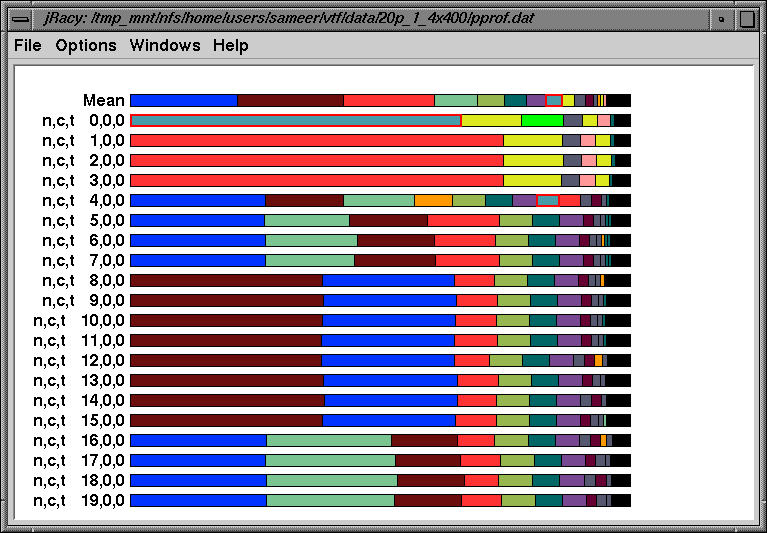
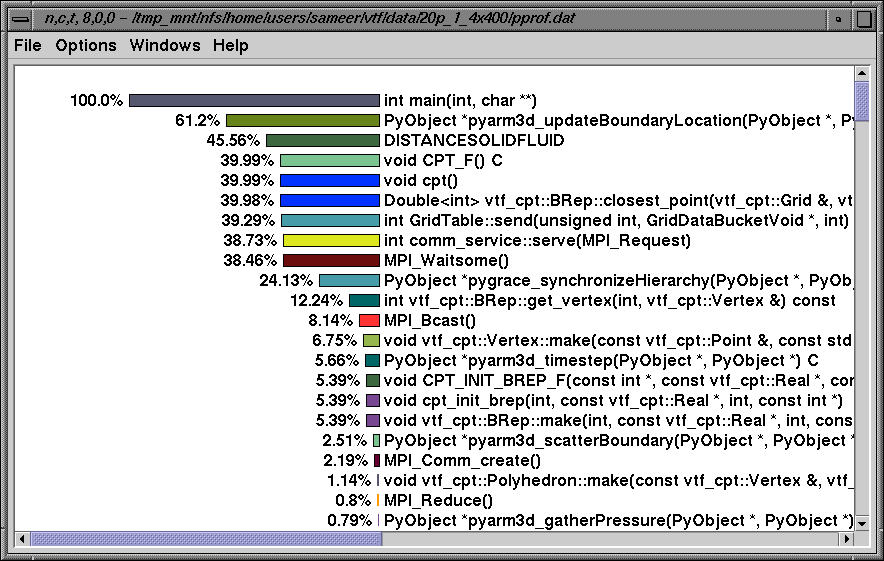
The above profile shows the breakdown of the wallclock time spent in all routines over 20 processors. Note that nodes 1-3, 4-7, 8-15 and 16-19 look similar.
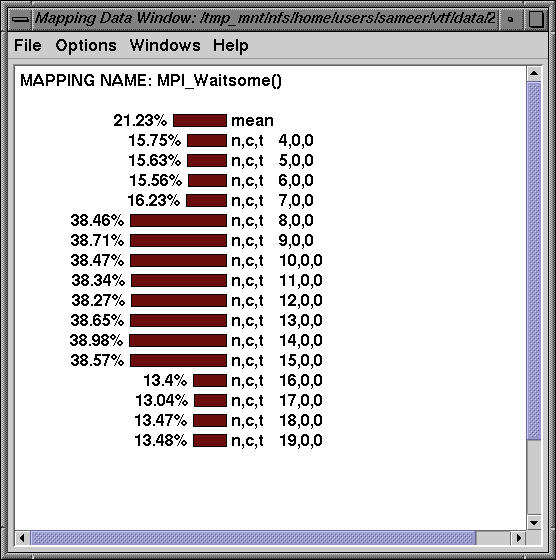
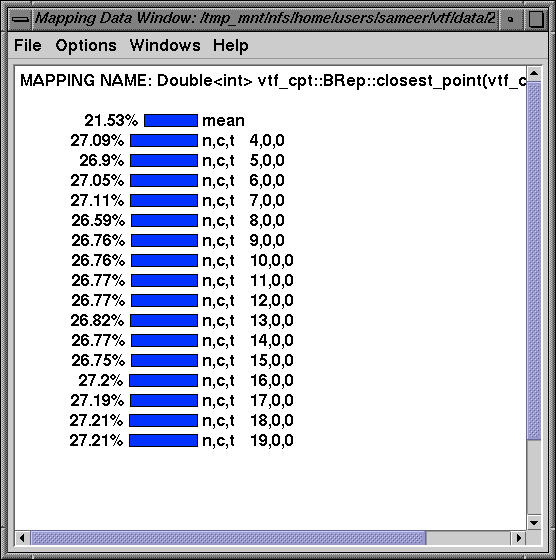
Routine MPI_Waitsome takes up a significant portion of time on nodes 4-19 as does the following routine:
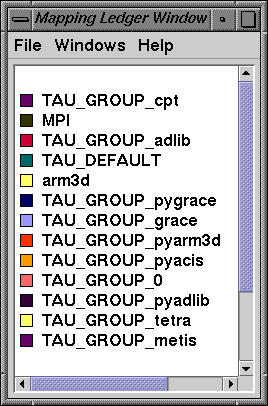
The routines are partitioned into different TAU groups as shown above and jracy permits the user to select a specific group in any display, or to exclude a group from the given display.
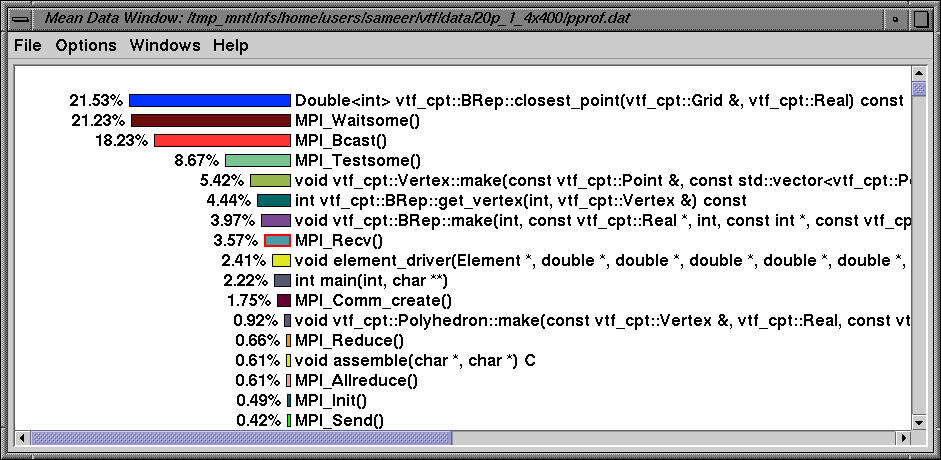
The mean window above highlights the average exclusive time spent in all routines across all nodes.
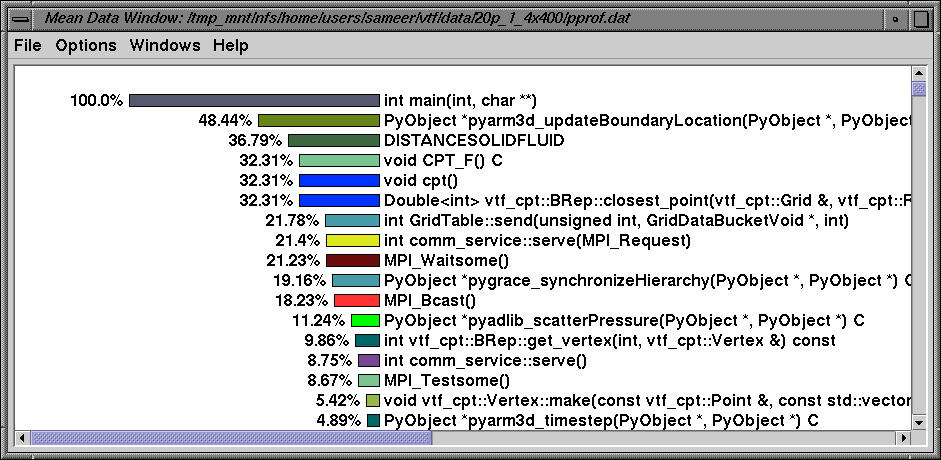
jracy allows the user to sort the data using inclusive time.
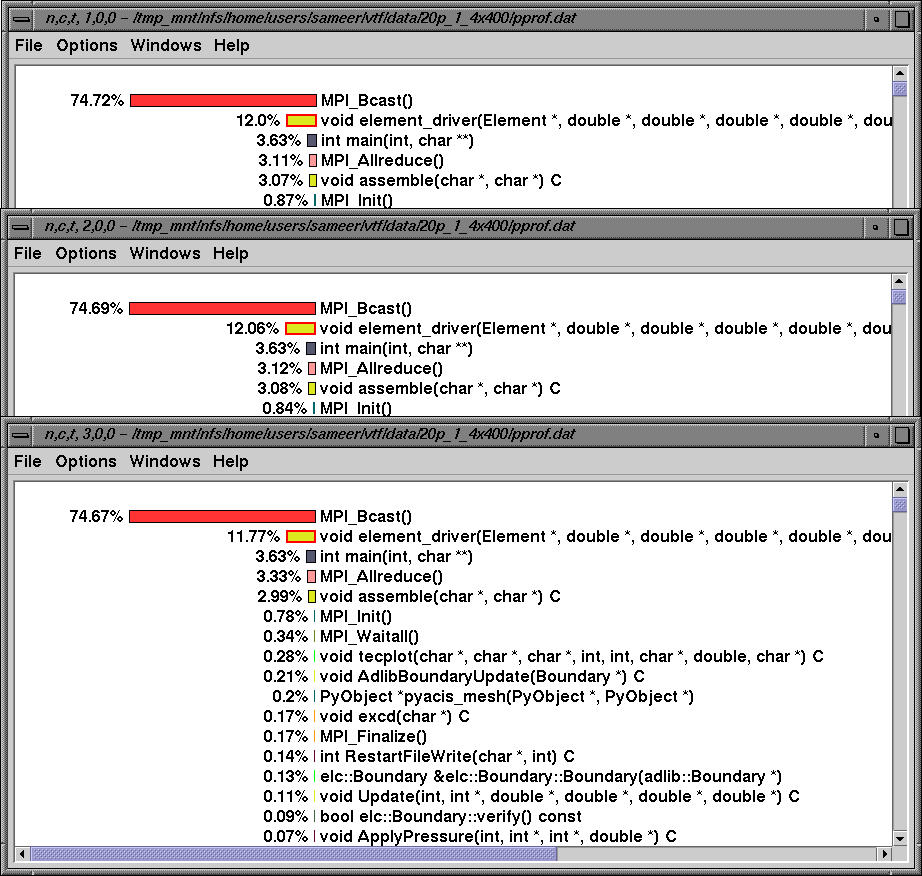
Nodes 1-3 have similar profiles where the routine MPI_Bcast dominates. The above figure shows the exclusive time on the given nodes.
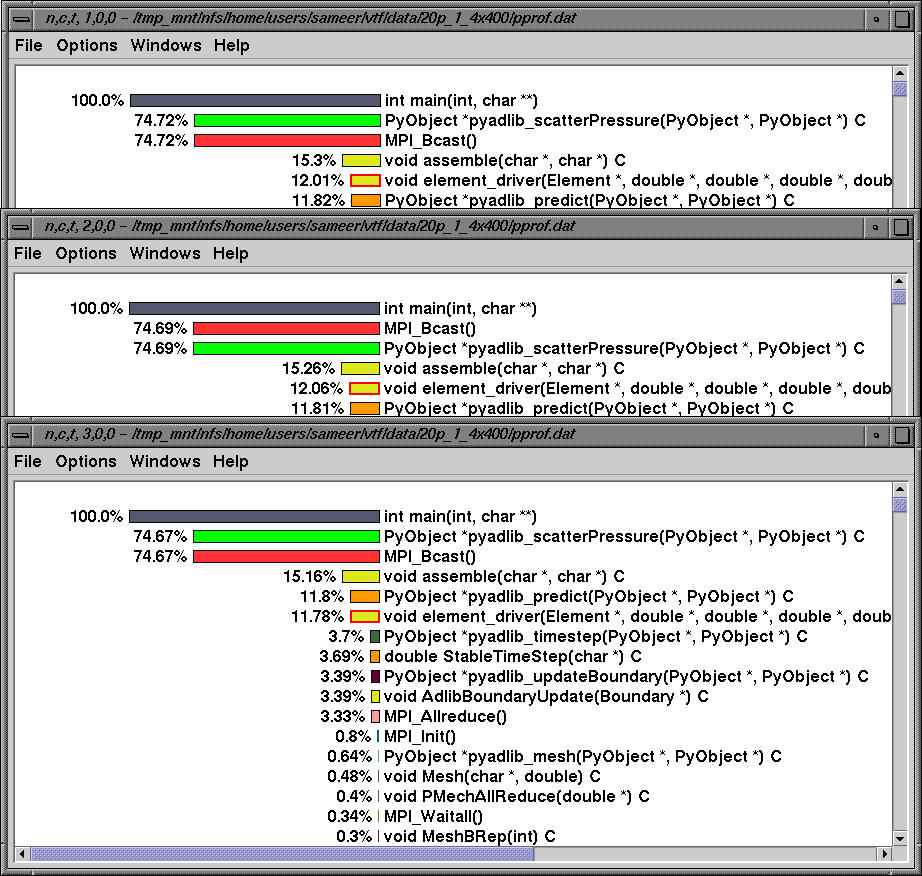
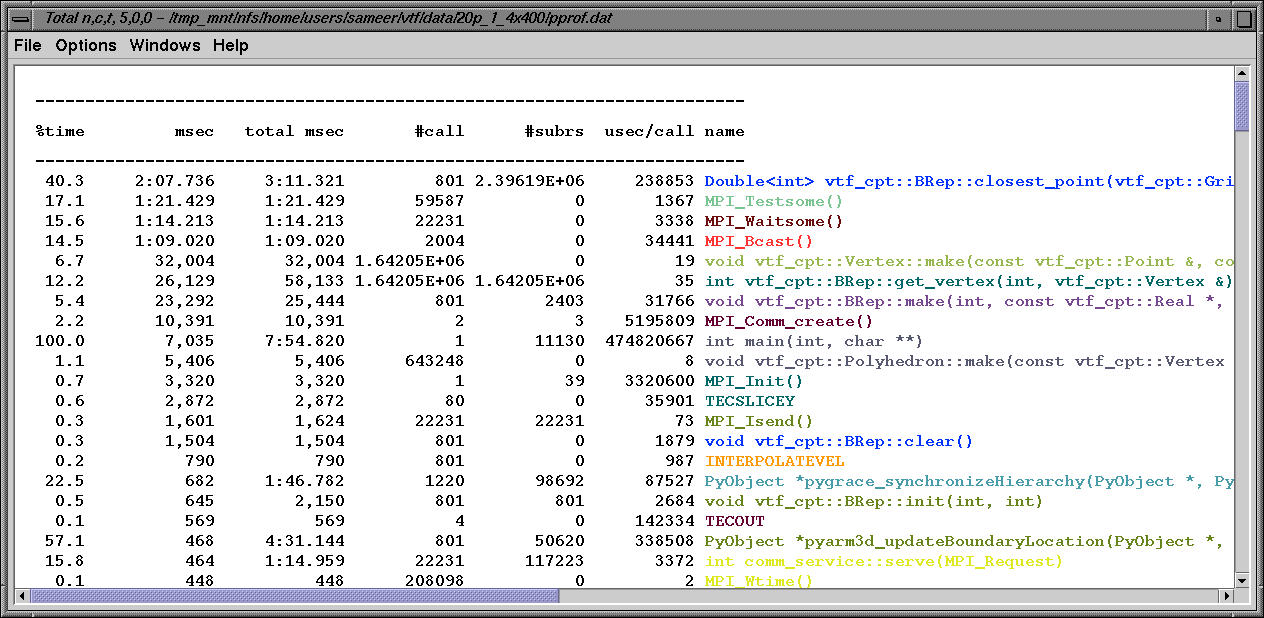
The same profile is shown using inclusive time.
Node 4 has a distinct profile. The above figure shows the exclusive time spent in node 4.
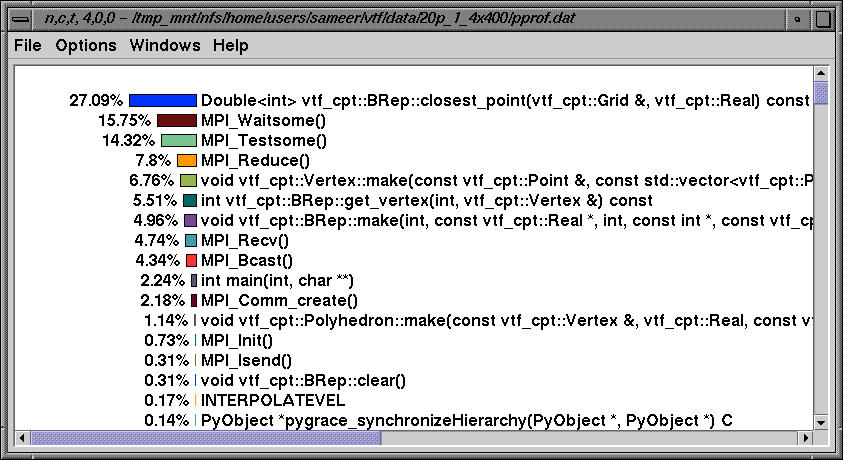
Nodes 5-7 have a similar profile. Performance data on these nodes is sorted by exclusive time.
The textual profile shows the exclusive time spent in routines on node 5.
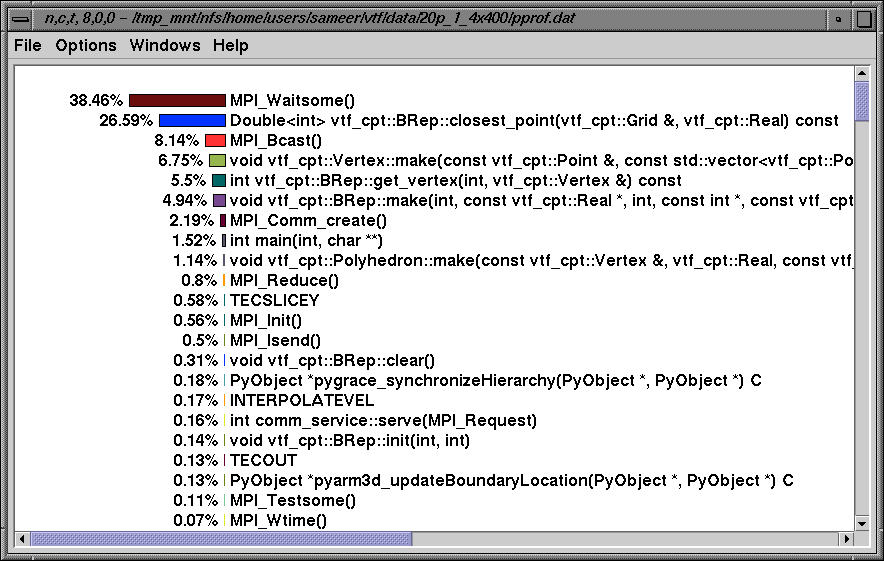
On nodes 8-14, MPI_Waitsome dominates. Here, we see the exclusive time and below, we see the inclusive profile on node 8.
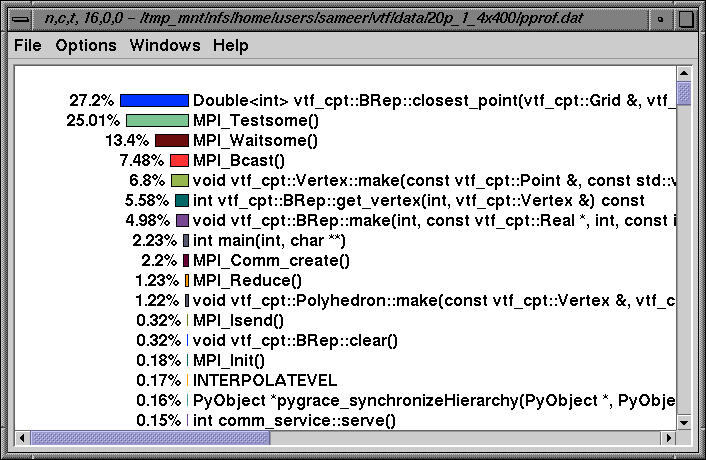
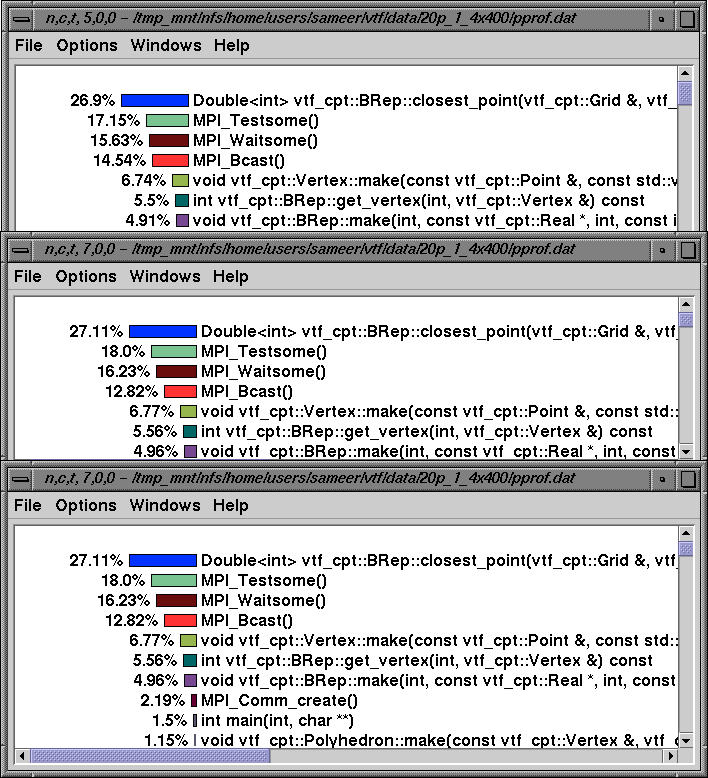
Nodes 16-19 have a similar profile too. Here, we see the profile on node 16 sorted by exclusive time.
numcalls>400000 & usec/call<12This removes routines that execute over a 400000 times and take less than 12 microseconds of inclusive time.