Racy (Routine and data ACcess profile displaY)
is the parallel profile data viewer. After compiling
an application for profiling and running it, racy lets
you browse through the function and collection access profile
data generated.
As with the other
tools, racy lets the user choose the level of
detail of the data displayed. The main window (see Figure 4)
gives a quick overview of the execution of the application by
summarizing function (left) and collection access (right) performance
in two graphs.
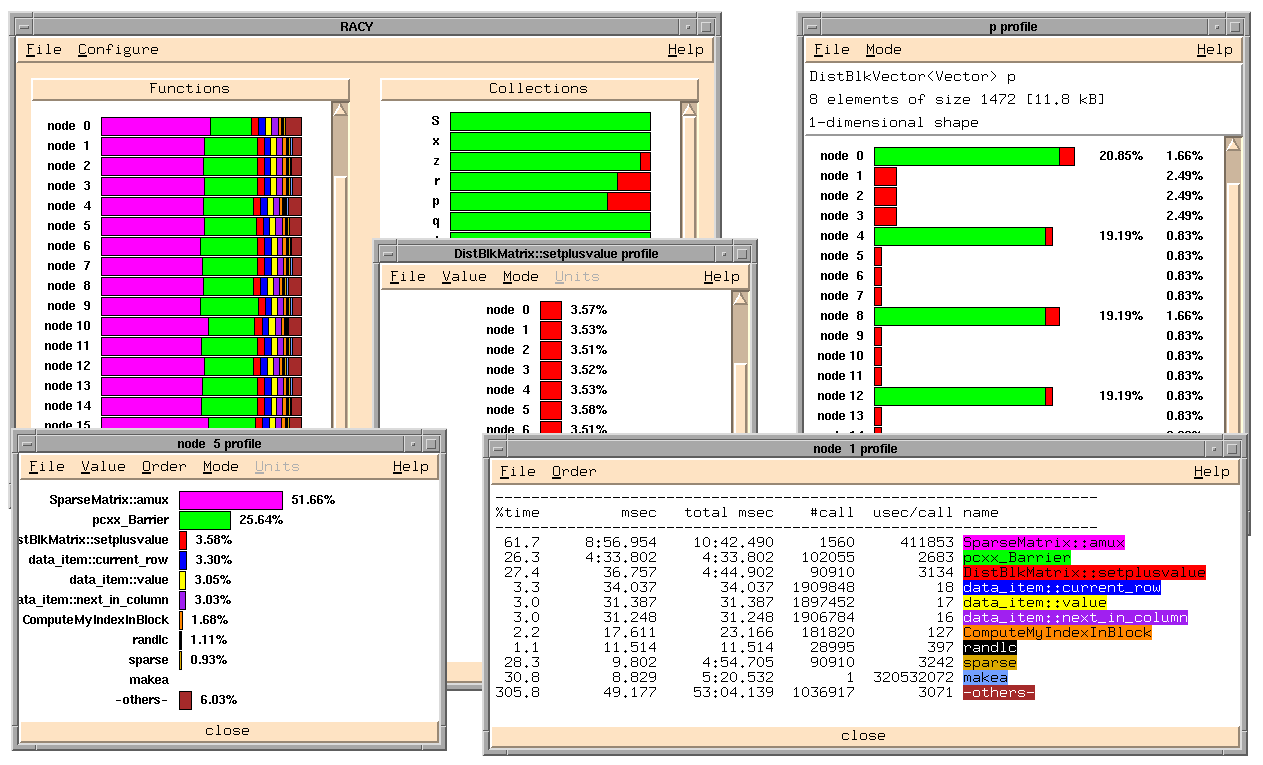
The function profile summary presents, for each node the program was running on, a single bargraph line showing the percentage of total runtime the program spent in specific functions. In addition, the mean, maximum, and minimum values are shown on top of the graph. Racy allows the user to easily explore the profile data and get different views on it by simply clicking on items within the bargraphs. This invokes more detailed displays:
The collection access data profile summary shows the user an overview of access information to collections (pC++'s distributed data objects) of the current application. For each collection declared in the program, a single bargraph line shows the percentage of all accesses to this collection which were local (access to local node memory) and remote (access involved costly communication). In clicking on the collection name at the left side of the bar, the user can get a more detailed view of the profile data for that collection, showing the local/remote access ratios for each node the program was running on. Figure 4 shows a node profile for node 5, a text node profile for node 1, a function profile for DistBlkMatrix::setplusvalue, and a profile for collection p.