

Next: Integration in Application Build
Up: Measurement
Previous: Multiple Metric Measurement
At the entry of each routine, TAU can
inspect the heap memory used and trigger this value using user-defined
events that tie it to the routine name. This generates performance data
that includes statistics such as the number of samples, maximum, minimum,
mean, and standard deviation of the value. The user must configure TAU
with the -PROFILEMEMORY configuration option to record heap memory
utilization in this manner. TAU also supports tracking memory headroom, or
the amount of memory available on the heap before the program runs out of
memory. Again, an event correlates this value with the routine name, and
generates these statistics as shown in Figure 1. To
enable collection of this information, the user must choose the -PROFILEHEADROOM option during configuration. On the Cray XT3, TAU uses
the heap_info() system call to extract the heap memory utilization
and memory headroom available. On other systems, it computes the headroom
available using a series of malloc() calls that allocate chunks of
memory. The amount of memory requested at each call is twice the amount
requested in the previous call. When the system runs out of memory, it
requests for the smallest chunk and if it successful in allocating it, it
requests twice as much until it cannot allocate even the smallest amount.
At that point, all memory is exhausted and TAU computes the memory
headroom in this manner. Thereafter, it frees up all the memory blocks
allocated in this manner and associates this data with the currently
executing routine. Clearly, the presence of the heap_info() system
call helps us develop memory introspection tools and it would help tool
developers if such library routines were available on other systems as well.
TAU uses system specific interfaces where available and portable mechanisms
elsewhere.
TAU also supports tracking heap and headroom using timer interrupts for a
single global event. Headroom can be associated with the currently
executing callpath as well. However, these calls need special annotations
in the source code, unlike the two configuration options described above.
Figure 3:
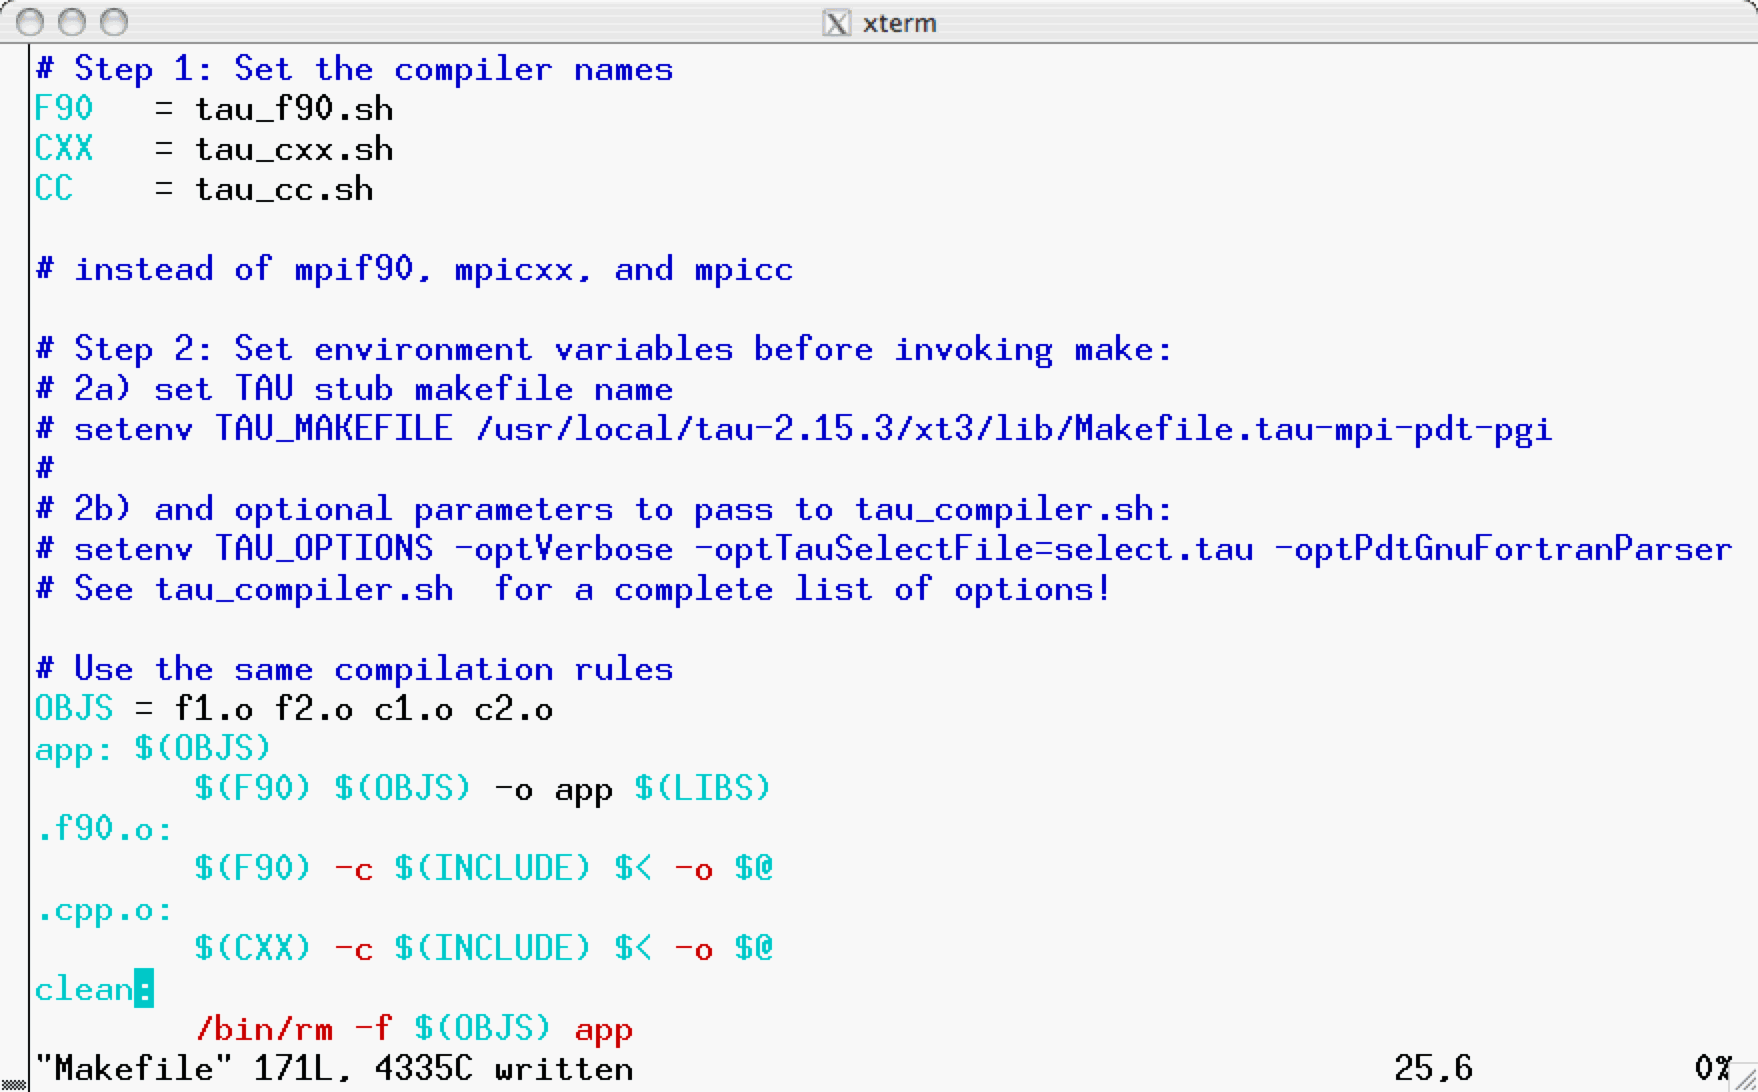
Modifications to the application makefile to use TAU are minimal
|
|


Next: Integration in Application Build
Up: Measurement
Previous: Multiple Metric Measurement
Scott Biersdorff
2006-05-05
