Gretel is an open source test coverage monitoring tool for Java programs. The current version provides statement coverage monitoring (identifying which lines of Java have been executed, and which have not been touched by testing). It works with compiled class files, altering them to include instrumentation for detecting which lines have been executed.
The primary difference between Gretel and other coverage monitoring tools is that Gretel implements residual test coverage monitoring: After you run a program that has been instrumented with Gretel, Gretel can re-instrument the program and remove instrumentation for those parts that have already been executed. Since most programs spend most of their time in a few small regions, which are easily covered in the first few test runs, residual re-instrumentation with Gretel greatly reduces the performance penalty of test coverage monitoring.
Gretel was constructed by Carl Howells. It is a complete reimplementation and partial redesign of the system described in Pavlopoulou and Young, "Residual Test Coverage Monitoring," which appeared in the Proceedings of the International Conference on Software Engineering, 1999, Los Angeles. Gretel was developed at the University of Oregon as part of the Pacemaker / Perpetual Testing projects sponsored by DARPA and Air Force Rome Laboratories; see http://www.cs.uoregon.edu/research/perpetual for details. The latest information and new versions of Gretel are available at http://www.cs.uoregon.edu/research/perpetual/Software/Gretel.
To use Gretel, you must have:
Note that this version of Gretel instruments only Java applications; it cannot be used to test applets.
Unzip either the Gretel.tgz or Gretel.zip file, whichever was downloaded, to the the location Gretel is to be installed in. Then, follow one of these system dependent procedures:
Some of the Gretel source code was generated with CUP, which can be found at www.cs.princeton.edu/~appel/modern/java/CUP/, and some of the code was generated with JFlex, which can be found at jflex.sourceforge.net. As long as the .java files generated by those tools remain, neither CUP nor JFlex is necessary to compile or use Gretel. However, if the JFlex or CUP sources are changed, those tools will be needed to generate some of the .java files necessary to compile everything else.
The main steps in using Gretel are:
Initial instrumentation requires that you instrument any class files that will be used to begin execution of the system. If an instrumented class is used by a program invoked through a non-instrumented class, a NullPointerException will be thrown, as the array used to represent the hit table internally will not have been created.
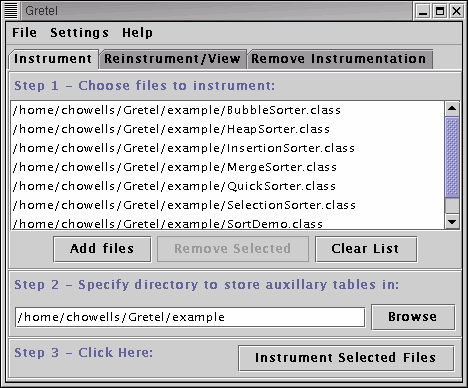
Start Gretel. It should start at the instrumentation pane automatically. If it doesn't, change to that pane. Click on the "Add Files" button, and select the .class files you wish to instrument. The list can be modified using the "Remove Selected" and "Clear List" buttons. Once the correct files are selected, proceed to the next step.
Select a directory to store the line table and hit table in.

Click the "Instrument Selected Files" button.
Running instrumented code will require adding the BCEL-runtime.jar file in the lib directory to the classpath used when executing that code.
Gretel does several things during the initial instrumentation process. First, it adds probes to the selected class files to record execution. More details on where the probes are inserted is in the next section.
Second, it creates a .gretel file for the class files which were instrumented and contain a main method, or static initializers. This file contains the location of the line table and hit table, and the size of the hit table. These files are used when the instrumented program starts, in order to determine the necessary size for the hit table, and the location to write it to. They are also used during the reinstrumentation process and in the sourceviewer, in order to locate the correct hit table and line table files. The tools make sure that the files stay in sync with each other during instrumentation, reinstrumentation, and removing probes. However, no external sync mechanism is provided, so if changes are being made to one of these files manually, make sure they are made for all the .gretel files associated with entry points to the program.
Third, it creates a lineTable file in the selected directory. This file contains the information necessary for relating probe numbers with sections of code. This table is necessary for interpreting results, but not for execution.
There is also a hitTable file generated in the selected directory, although it isn't created until the instrumented program has been run to completion (successful or otherwise) once.
In order to see what has been marked as executed, go to the Reinstrument/View tab in Gretel. Select an appropriate .gretel file to get a list of instrumented files. Select an instrumented file, and either double click on it, or click the "View Source" button.
If the source files (.java files, usually) aren't located in the same directory as the .class files, you will be prompted for the location of the source for the selected .class file. If the name of the source file isn't what Gretel was expecting, it will show a dialog that says so, then show the selected source file regardless. Gretel compares the file name with the contents of the .class file's "source" attribute, which is usually set by the compiler. If the selected file name is different from the contents of that .class file's source attribute, this could mean that the source attribute was wrong, or that the wrong source file was selected. If the wrong source file was selected, the highlighting in the display will not match the displayed source.
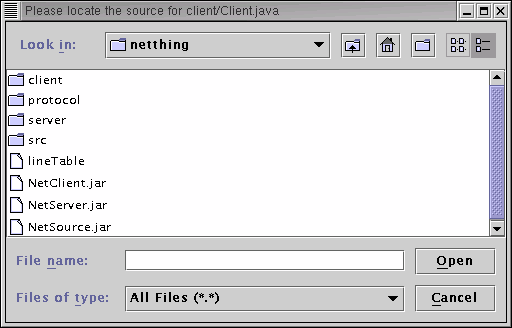
Another possibility is that the compiler included directory information in the source attribute, which is technically a compiler error. The display will be correct in this case. However, the next time that source file viewed, the user will be prompted for its location again.
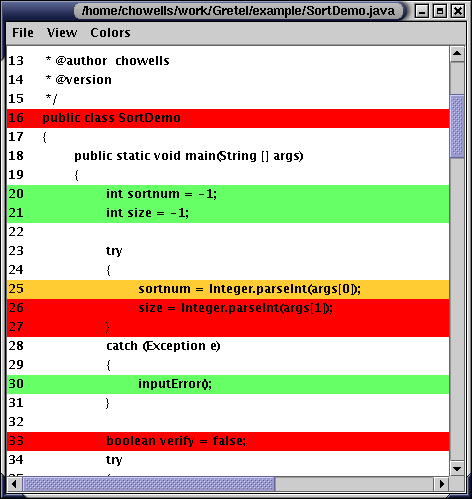
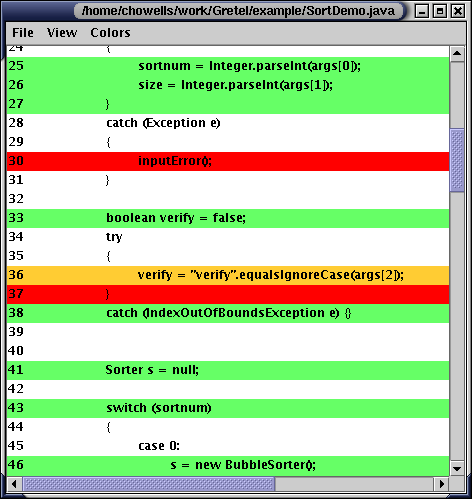
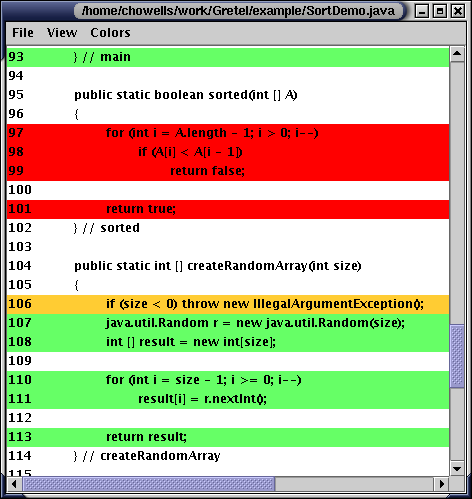
The source file being shown will have many lines highlighted in various colors. The default colors are green, orange, and red, but those may be changed through the Colors menu in the source viewer. A line's color indicates its execution status. In the default color settings, a green line indicates that all instrumented code that line contains has been executed. A red line indicates that all instrumented code that line contains has not been executed. An orange line indicates that some of the instrumented code from that line has been executed, and some hasn't. A white line means that there is no instrumented code associated with that line.
Since the execution status indicated may have some apparent inaccuracies, it's worthwhile to know when code is marked as having been executed. To really make sense of that, though, it helps to know the procedure used to determine where to place probes in the code. If this is too much information, skip ahead a bit to when the consequences are discussed.
Instrumentation is done one method at a time. First, a control flow graph for the method is created. Due to exceptions and the JSR instruction used to implement finally blocks, it's not quite a completely obvious process, but it is fairly simple. At this point, dependence on the instrumentation method is introduced. If "no node reduction" is selected, all of the basic blocks which make up nodes in the control flow graph are instrumented. Because the last instruction in a control flow graph is typically a change of flow control, the probe for that block is inserted before the last instruction of a block. If a setting other than "no node reduction" is selected, more work is done before instrumentation, though.
Next, the dominator tree of the blocks in the graph is constructed. This tree has the property that if a node in it has been executed, that node's parent must have been as well, with the obvious consideration that the root doesn't have a parent, and thus must be the entry point in the control flow graph. If Gretel is set for "Aggressive Node Reductions", the default state, the leaves of the dominator tree are the only blocks which are instrumented. Execution of the internal nodes in the tree is inferred from which leaves have been executed.
If "Conservative Node Reductions" was selected, one last step occurs. All edges in the control flow graph are checked to see if they go from a node to one of its dominators. If an edge does so, and that edge is not from a leaf in the dominator tree, the tree is broken at that node. That node is made a leaf, and all of its children become the roots of new trees in what has become a dominator forest. Then, all leaves in the forest are instrumented.
By this point, the question "So What?" has probably been raised. The above information has the following consequences. Code which has been marked as executed definitely has been. However, code which hasn't been marked as executed may have been, at least partially. A basic block is only marked as having been executed when it is fully executed. If an exception is thrown within a block, the parts of it executed before the exception was thrown won't be marked as having been executed. Or in a multi-threaded system, if another thread terminates the VM before the end of a block is reached, that block won't necessarily be marked as having been executed. The situation is a bit more extreme when node reduction is used, although usually the loss in precision is very minor compared to the gain in execution speed of instrumented code.
When some type of node reduction is used, it means that one of the above failures to mark a certain block as having been executed could also lead to blocks which dominate it not having been marked as executed. This is an unusual occurrence, but because it can happen the options to reduce the number of blocks where execution is inferred are offered under the settings menu. Try conservative reduction before no reduction, as it typically has most of the performance gains of aggressive reduction, but is a bit more careful. Only turn off reduction completely if you absolutely need every block to have its own probe.
Within the source viewer, double-clicking on a highlighted line will result in a dialog popping up which displays which instrumented code positions associated with that source line have and haven't been executed. The positions it reports are the same ones reported by running javap -c on the instrumented class file. Just be sure to get the correct method in the class file for that information to be useful.
After initial instrumentation, Gretel tracks the execution of every part of your application. Even though Gretel uses some optimizations to minimize the number of points at which your application is probed, the run-time overhead can be substantial. But after Gretel has noted that a particular block of program code has been executed, there is no need to monitor that block of code again -- the probe can be removed. Reinstrumenting your application removes the probes that are no longer needed, leaving in just enough probes to record the execution of blocks which haven't already been covered. This usually has the effect of removing most of the probes in "hot spots", and substantially reducing the run-time overhead for monitoring.
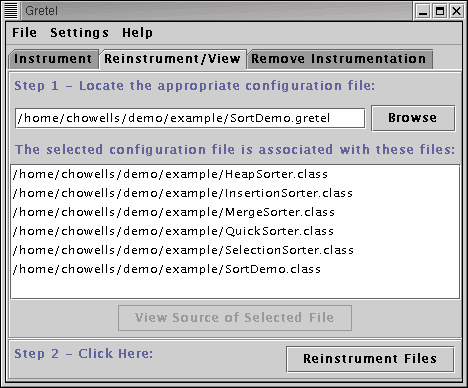
To reinstrument code, removing probes in sections which have been executed, open Gretel and go to the "Reinstrument/View" tab. Select one of the .gretel files which contains information on the project you wish to reinstrument. When such a file has been found, the "Reinstrument" button will be activated. Simply click on it to remove all probes corresponding to previously executed code in the .class files in that project.
If you wish to remove all instrumentation from a file, so that it can be run without the Gretel-runtime.jar file in the classpath, start gretel and go to the "Remove Instrumentation" tab. Select the files you wish to remove instrumentation from, and then click on the "Remove Instrumentation" button.
After extensive developer testing, a few parts of an application typically remain unexecuted. These may result from defensive programming (sanity checks and "can't happen" cases) or modules that are more general than they have to be in the context of this particular application (e.g., anticipating software reuse or future program features). The developers and testers believe that these untested parts of the program either cannot be executed, or are executed so rarely that they are not worth creating additional test cases.
Gretel was developed to support residual test coverage monitoring. That is, we can leave a few test coverage probes in the application to check our assumption that the residue of testing -- the portions of the application which have never been exercised by our tests -- are not executed by the end users. If an end user does execute a part of the application code that has not been executed by any of the test cases, that is a strong indication that an additional test case is needed. (Since Gretel does not provide specialized facilities for communicating test coverage from users to developers, and since many end users are likely to have concerns about privacy and confidentiality, monitoring end-user coverage is most appropriate as part of a beta testing program in which users voluntarily communicate gathered data to the development organization.)
Two factors have to be considered when distributing an application with residual coverage monitoring in them. First, the monitor classes must be distributed with the application. So make sure that the Gretel-runtime.jar file is included with the distribution (with a copy of the license and disclaimer), and that it is in the classpath when the application is run. Of course, the .gretel files used for config info must be included too, and should be in the same place as their associated Class files. That means if the class files are in a .jar file, the .gretel files should be in the .jar file with them.
The second consideration is the contents of the .gretel files distributed. In a distributed application, the location of the tables listed in those files will need to be updated. The lineTable entry can be removed, as it isn't needed. The size and hitTable entries are needed, though. Furthermore, the value of the hitTable entry should be changed to something to which it will be possible to write to. The best value would probably be something like "$home/.myapphits", making use of the fact that $home will be expanded in the monitor to the result of System.getProperty("user.home"). Under Unix/Linux/OS X, it will be the user's home directory. Under Windows 9x/ME, it will be the windows directory. Under windows 2k/XP, it is typically the user's home directory, except when logged in as administrator, when it might also be the windows directory. No matter what it expands to, though, it can always be written to, from what testing I've done. That means it's as good a choice to put the hit table as any, when working with a cross-platform app.
This is a short example of how to use Gretel. It assumes that you are working in a Unix environment, although 90% of the instructions should work without modification in Windows.
The example code is a simple demo of several sorting algorithms. It works well as an example because it is easy to run parts of the code selectively. It also is timed, which makes it useful as a benchmark to see how much of an impact Gretel's runtime instrumentation has.
Start by copying the example directory to the directory you wish to work in. Be sure to copy the directory itself, rather than just the files inside it. This is necessary because the files in the example directory belong to the example package.
The next step is to compile the example classes.
javac example/*.java
Run the example a few times, and take some notes on its speed.
java example.SortDemo
java example.SortDemo 0 5000
java example.SortDemo 5 15000
java example.SortDemo 3 5000 verify
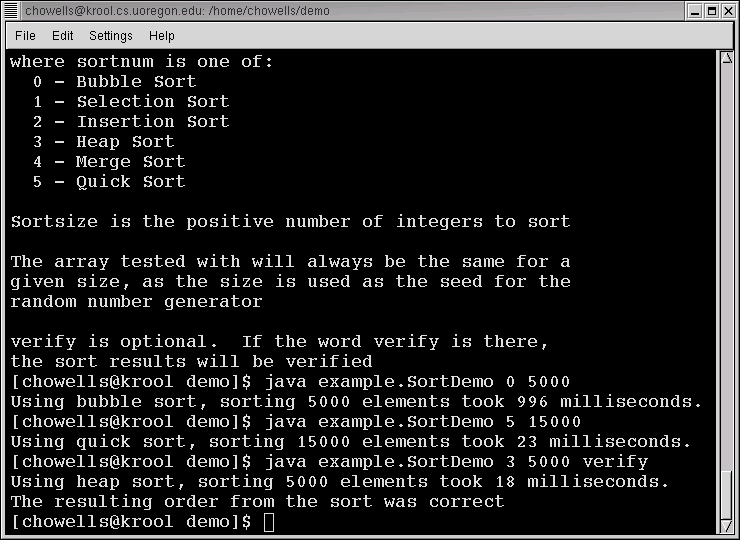
Now, start Gretel. Assuming it's installed correctly, the following command will start it as a background process.
gretel &
Make sure you are in the "Instrument" tab.
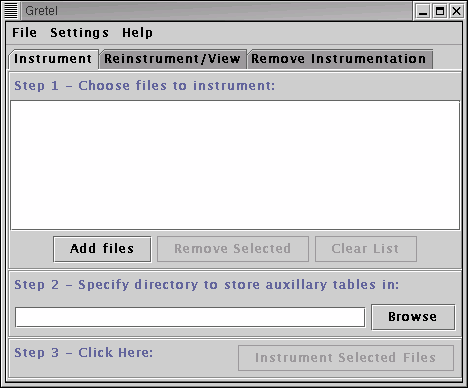
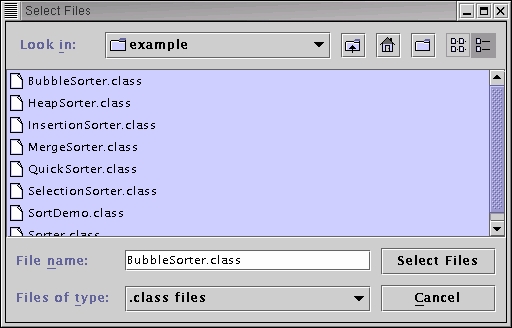
Click the "Add files" button, and go into the example directory and select all the class files.
.
Then click the "Browse" button, and select the example directory. To instrument the files, click on the "Instrument Selected Files" button. After clicking on the button, a small progress dialog will appear.


After it finishes, it will show a dialog informing you that it's done, and then it will change to the "Reinstrument/View" tab.
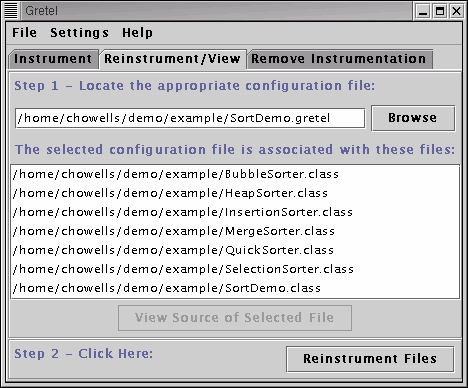
You'll notice that the configuration file field in the "Reinstrument/View" panel already contains a configuration file for the project that was just instrumented. If the configuration file wasn't listed, you'd need to find it in order for the instrumented file list to appear.
If you've been paying close attention, you might have noticed that seven files are being showed as instrumented, but eight files were selected to be instrumented. This is because the eighth file, Sorter.class, was compiled from an interface, and therefore contained no executable code to instrument. The "Reinstrument/View" panel's display shows only files that have instrumented code in them, for a given configuration file.
Select the SortDemo.class file, and click on the "View Source of Selected File" button. The code should, at this point, all be highlighted the "Not Executed" color, which is, by default, red. The colors can be changed through the "Colors" menu in the source viewer.
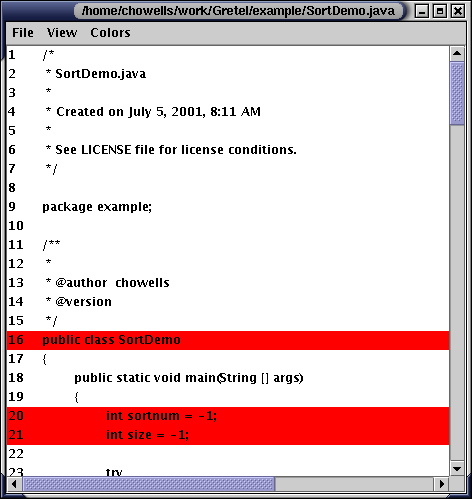
Now, go back to the terminal window. Run the SortDemo with the following settings, making sure to substitute in the correct path.
java -classpath .:/path/to/Gretel-runtime.jar example.SortDemo 0 5000
Note the increase in time, due to the insertion of runtime instrumentation.
Now return to the source viewer window, and go to the file menu and choose refresh. Now large parts of the code will be marked as executed, and large parts will still be marked as unexecuted. More interested are lines 36 and 106, which are marked as "Mixed." Mixed means that part of the instrumented code for that line has been executed, but not all of it. On line 36, the code to access location 2 of the args array was executed. However, the comparison wasn't executed, as that array access threw an ArrayIndexOutOfBoundException. On line 106, the condition in the if statements was executed, but because it turned out false, the rest wasn't executed.
Go back to Gretel's main window, and click on the "Reinstrument Files" button. You'll notice that the BubbleSorter.class entry was removed from the window, as all the instrumented code in that class was executed, so all instrumentation in that class was removed.
Return to the source viewer for SortDemo.java, and refresh the view again. You'll notice that all lines which were highlighted as executed are now unhighlighted, and lines which were highlighted as mixed are now highlighted as not executed. In the second case, it doesn't mean that the instrumentation for the part of the line that was executed is still in the file. Rather, it means that the only remaining instrumentation for that line is associated with code that hasn't been executed. The instrumentation for the code that had been executed was removed, as expected.
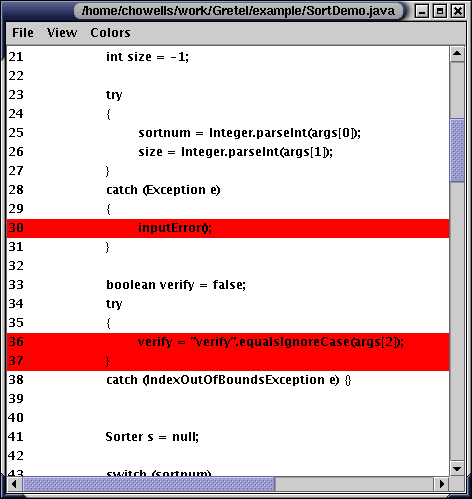
In order to get more details on what code has and has not been executed for a given line, double click on that line in the source viewer. You will receive an information message like
Positions 39 through 51 in method main([Ljava/lang/String;)V, class SortDemo have not been executed.
The code positions reported (39 through 51) correspond to the byte code positions reported by the javap -c command, enabling you to figure out exactly what blocks of code haven't been executed fully. Method signatures are given using the Java virtual machine encodings, e.g., "[Ljava/lang/String;" is the internal name for the type java.lang.String[ ], and the V suffix indicates a virtual method call. This is also the syntax you will see if you disassemble your .class files using the javap -c command.
Run the sort demo again.
java -classpath .:/path/to/Gretel-runtime.jar example.SortDemo 0 5000
java -classpath .:/path/to/Gretel-runtime.jar example.SortDemo 5 15000
You should see that the bubble sort has returned to its original speed, or at least close, depending on which JVM is being used. The quicksort will still have a performance penalty, as it will still have its instrumentation in it.
Run the sort demo in as many different ways as it takes to cover as much of it as possible, reinstrumenting as needed along the way. I'm confident that you'll find that parts of lines 16, 90, 99, and 138 will never be executed. 16 corresponds to the constructor for the SortDemo class, which is never called. 138 corresponds to the return statement in a method which always calls System.exit(1), and so the return will never be reached. Lines 90 and 99 would only be executed if there was an error in one of my sorting algorithms. As I'm sure I have completely debugged those algorithms, I'm sure those lines will never be executed.
However, it's possible that a situation I never anticipated, and never encountered during my testing, will cause one of the sort algorithms to fail. Leaving the instrumentation in during beta testing (if my application was something bigger than a sort demo) would permit me to check the assumption that those lines of code are never executed.
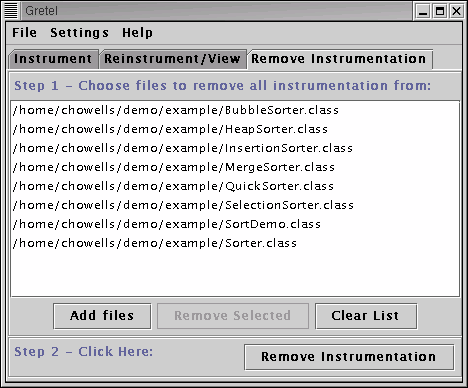
There is one last part of the example. If you want to remove all instrumentation from a project, so that it can be run without the Gretel-runtime.jar file in the classpath, there are two options. First, simply deleting all the Class files in the project and then recompiling them would remove all instrumentation. If that isn't an acceptable solution for some reason, you can go to the "Remove Instrumentation" tab, and add ALL the class files in the project to the list of files it has. Then click on the "Remove Instrumentation" button.
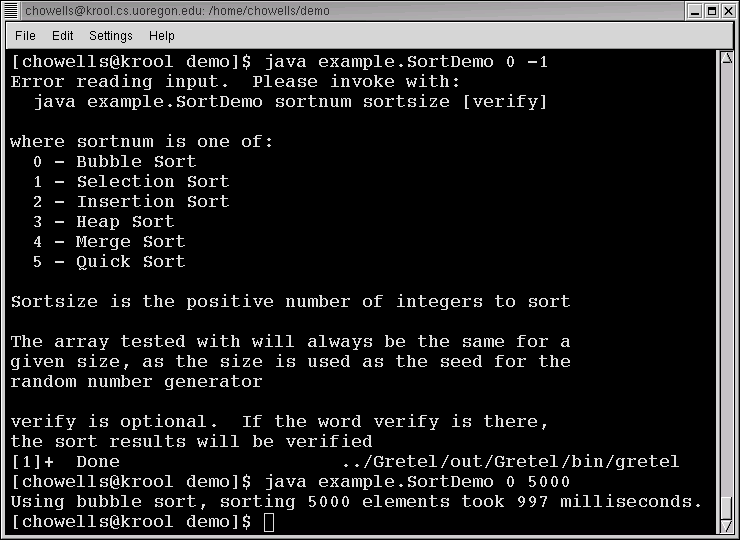
After that, the project can be run normally again
.
Supplying gretel with a command line argument causes it to not execute the GUI. Rather, it will run one of the command line tools, or print an error message if the argument wasn't understood. In this way, Gretel can be invoked from shell scripts, makefiles, and other development tools.
The valid command line arguments are:
There are some issues running under IBM's 1.3.0 JVM. If it does strange things like not reporting as executed sections of code which must have been, try upgrading to the newest version of IBM's JVM.
Another viewer is planned, that is independent of source code. However, it is still in design stages, and not near implementation at the moment.
Gretel is currently not compatible with JUnit, because it depends on instrumenting a "main" program. A JUnit-compatible version is planned for the near future, thanks to contributions by Niklas Mehner.
Here are solutions to the most common issues encountered by users of gretel.
The instrumentation added by Gretel affects runtime timing. Because of this, race conditions between multiple threads of execution might be exacerbated by Gretel, perhaps leading to previously unseen failures. If something strange is going wrong with multithreaded code after instrumentation, check to make sure it is all synchronized correctly.
We would like to hear from Gretel users, and we invite others to contribute to Gretel as an open-source project. The preferred contact method is electronic mail, at either michal@cs.uoregon.edu or chowells@cs.uoregon.edu . The Gretel home page is http://www.cs.uoregon.edu/research/perpetual/Software/Gretel.
Last update: 2002-06-24