To automatically analyze your instrumented project on a Unix-based system TAU must first be configured with the -JDK option, and any other options you want applied to your trace output. On windows the type of analysis to be conducted, Profile, Call path or Trace, should be selected from the Window, Preferences TauJava Preferences menu.
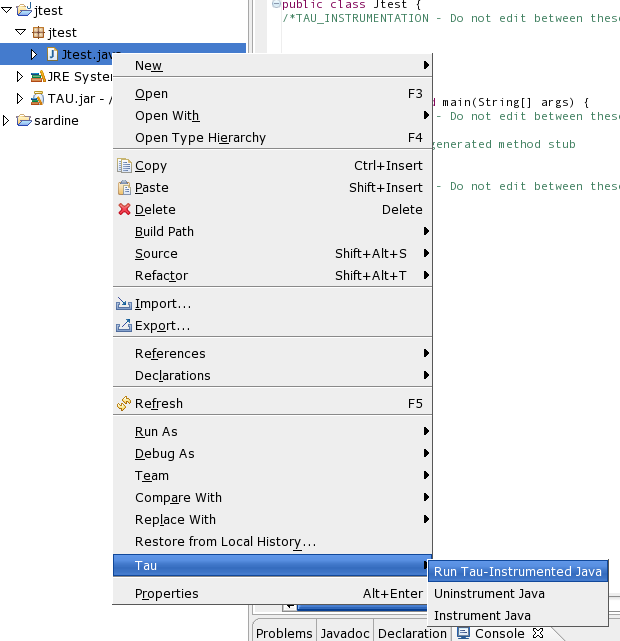
Once that has been accomplished, right click on the Java file containing the main method you want to run, go to the TAU menu and click on Run Tau-Instrumented Java. The program will run and, by default, the profile and/or trace files will be placed in a timestamped directory, inside a directory indicating the name of the file that was run, in the TAU_Output directory in the home directory of the Java project.