![[TAU Logo]](../images/tau.xbm)
After compiling an application for profiling and running it, racy lets you browse through the function and aggregate profile data generated.
Go to RACY in the Tools menu to invoke it.
|
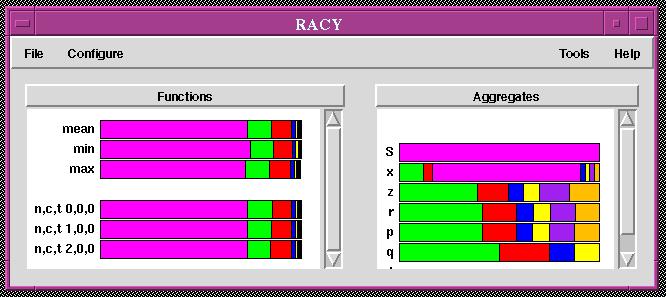
On the left we see the profile of functions and on the right we see the aggregate profiles showing the number of significant events on each aggregate over all nodes.
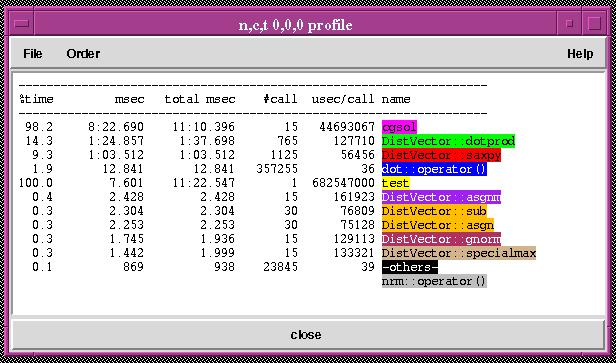
To investigate the profile of all functions on a node, click on node n,c,t 0,0,0. This represents the profiling information on node 0, context 0 and thread 0.
|
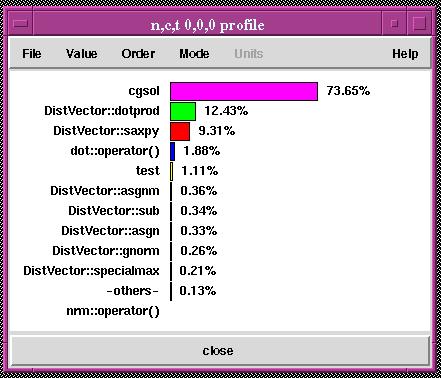
| Click on the function with the maximum execution time. |
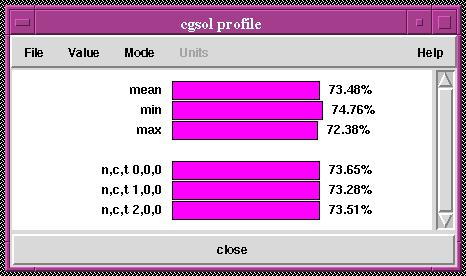
cgsol on each node, and aggregated over all nodes (showing mean, min, and max time).
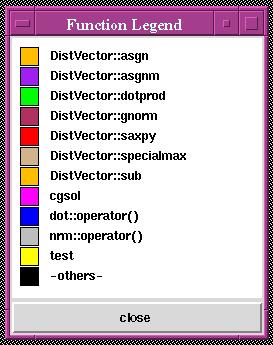
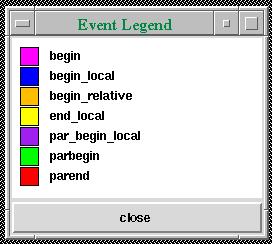
Go to File and Show Function Legend to view the color-coding key for profiled functions.
|
As in the other tools, we can click the middle mouse button to get function information. Furthermore, the Options and Mode menus contain numerous ways to reconfigure the profile displays.
In the main racy window, click middle mouse button over n,c,t 0,0,0 to see the textual information for the node
|
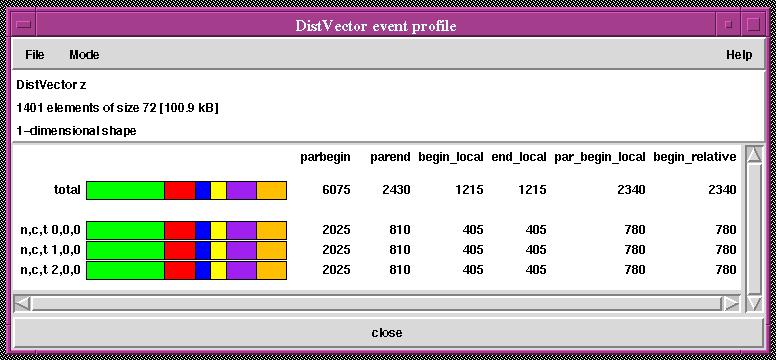
Next, we examine the Aggregate profiling data. Aggregates are objects of a class that exist over one or more threads and contexts. Racy displays the number of events that are associated with each object over all nodes, contexts and threads.
Go to File and Show Event Legend to view the color-coding key for profiled functions.
|
Click on the aggregate z to see the event profile of this object. It shows the total number of events as well as the distribution on each node for the different events that take place on this aggregate.
|
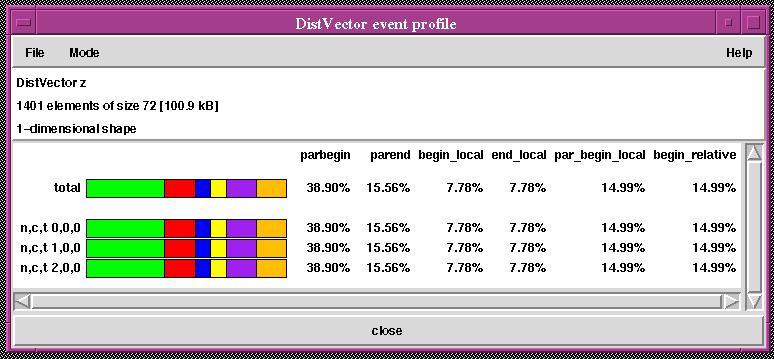
Go to Mode and select percent to display percentage of events that took place.
|
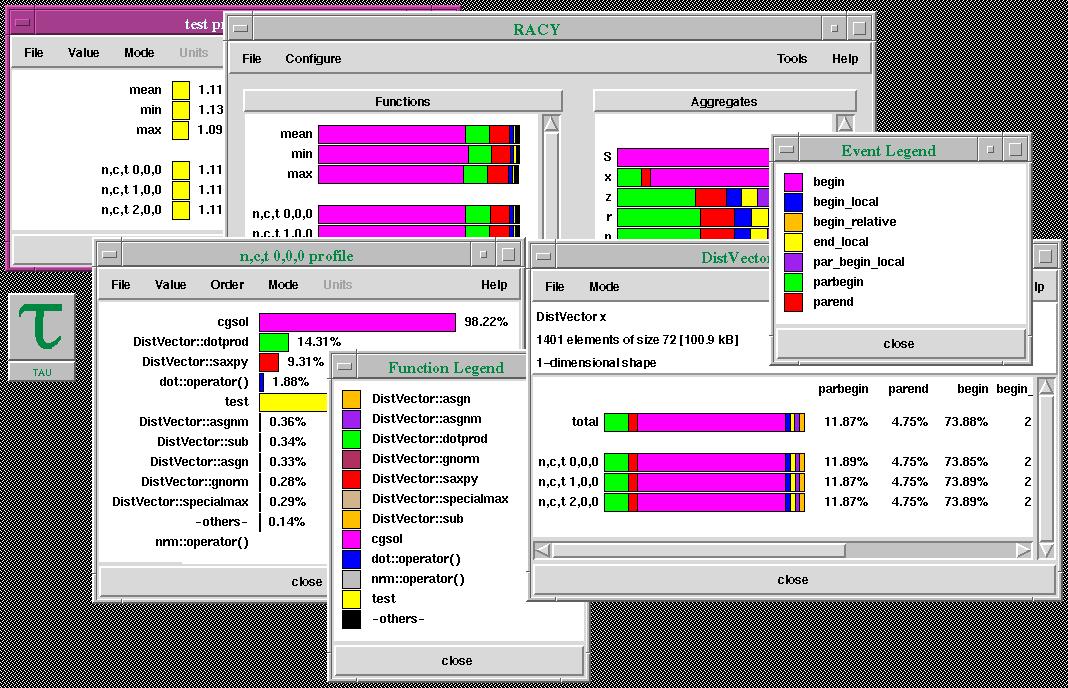
The complete display of racy and all its windows is shown here.
Exit from main TAU window will cause all running tools to exit.Continue with the next button below for links to further in-depth information about TAU.
![[PREV]](../images/prev_ball.gif)
![[Back to tutorial]](../images/back_to_tutorial.gif)
![[NEXT]](../images/next_ball.gif)