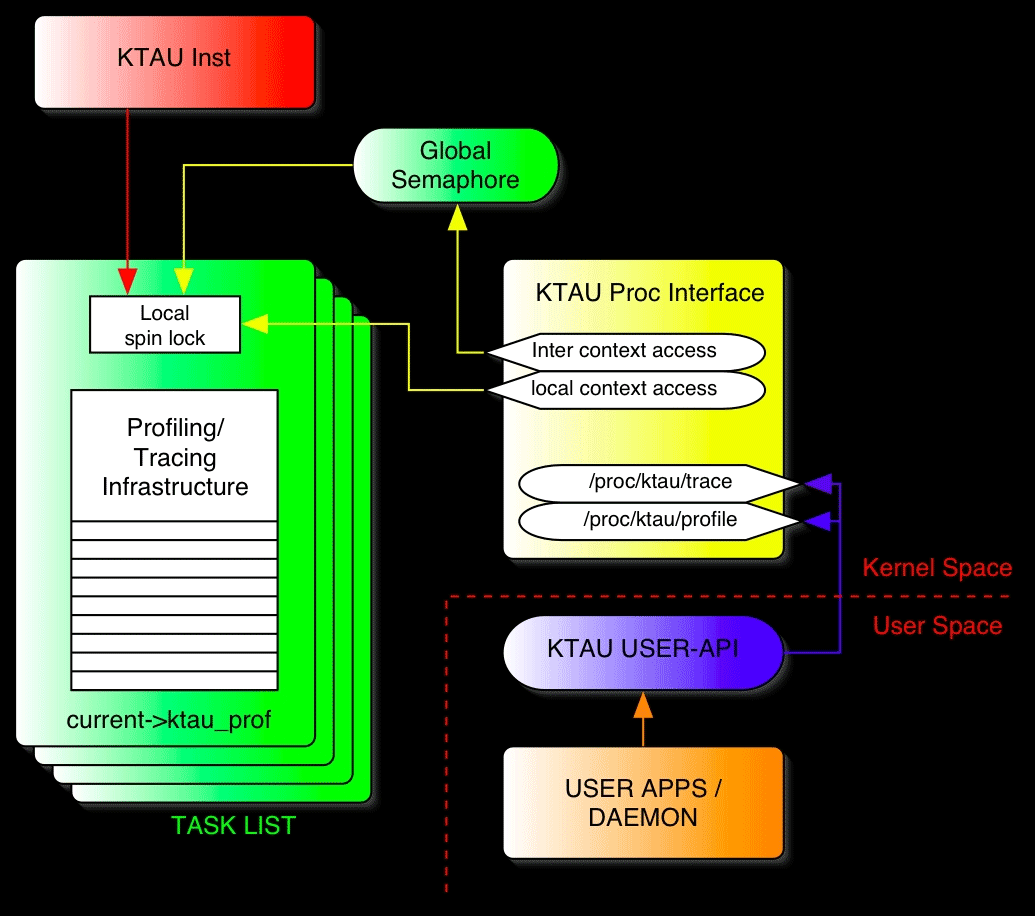
KTAU comprises four individual modules.
-
TAU Instrumentation
-
KTAU Infrastructure
-
KTAU Proc Interface
-
KTAU User-space API Library and Utilities
KTAU places instrumentation points in
Linux kernel source to intercept the execution path in order to extract
the performance data of interest. For instance, KTAU
places instrumentation at the entry and exit point of a kernel routine
to measure the amount of time spending inside the routine. Time
measurement is in tick, which is obtained from the timestamp counter in
the processor. In most Intel processors, tick rate is normally equal to
the clock speed of the processor.
For each function being instrumented,
KTAU assigns a unique ID at runtime. This ID is
assigned dynamically depending on the order the function was executed.
It is assigned once at the first time a process execute the function,
and will be maintained as long as the system is running. In other word,
the ID is not bound to the function across the system reboot. This ID
is used as an index into a table, which stores profile data of each
function. This technique allows profile data to be accessed directly
with out searching through a list of functions.
KTAU main infrastructure resides in
task_struct of each process. It consists of a profile table, a circular
trace buffer, locks, and state variables. The profile table is used to
store profile data (i.e. amount of time a process spent inside a
function, counter, etc). The function ID is used to index into the
table. Currently, the table has 1024 entries, which are grouped into
ranges that adopt different indexing schemes. Please refer to appendix
A for more detail.
With the existing instrumentation, KTAU
can trace execution path and maintain the history in the circular trace
buffer. The buffer has 1024 entries, which wraps over once all entries
are filled up. Currently, the buffer does not handle trace lost due to
the wrap over. The wrap over period depends on the speed of processor,
and amount of instrumentation in the kernel. KTAUD
can be used to export the trace data periodically. However,
applications can export this information directly through the provided
KTAU API library.
KTAU uses /proc filesystem as a
communication channel between kernel-space and user-space.
/proc/KTAU/profile and
/proc/KTAU/trace are used for accessing profile data
and trace data respectively. Generally, applications from user-space
access the data through provided API library, which uses ioctl as
underlying communication method.
KTAU provides API library for accessing
profile/trace data inside the kernel. Currently, only data-access API
is provided, but more API can be extended to implement runtime
management mechanism. Please refer to
KTAU/user-src/include/KTAU_proc_interface.h
for more detail. Furthermore, utilities are provided to help analyzing
the profile/trace data. For example, each function being profiled
registers its memory address into the corresponding entry in the profile
table. This memory address is used to represent the function instead of
the function name. Therefore, the output obtained from the read API
returns profile data with memory addresses. KTAU
provides funcMap tool to map the memory addresses in the trace/profile
output to the corresponding function name listed in kernel symbol table
(i.e. System.map or /proc/kallsyms). Please see
KTAU/user-src/src/README" and
"KTAU/user-src/src/example.txt"for detail on
KTAUD and funcMap.
