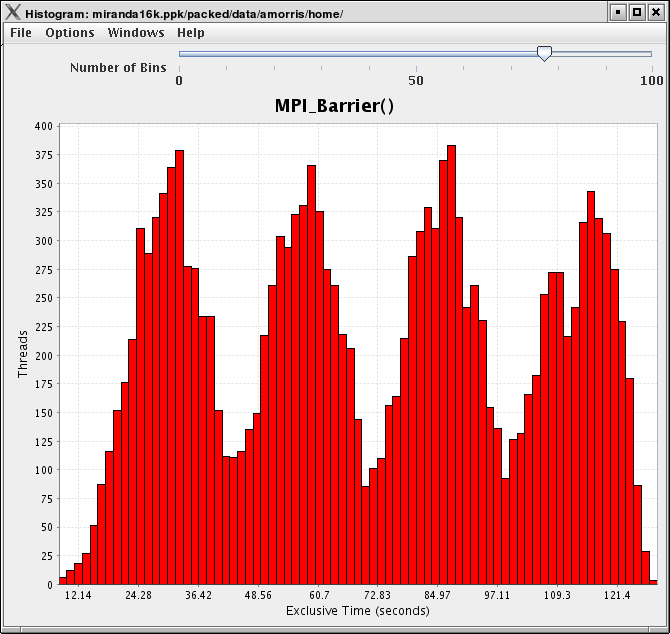
This display shows a histogram of each thread's value for the given function. Hover the mouse over a given bar to see the range minimum and maximum and how many threads fell into that range. You may also change the units and metric displayed from the Options menu.
You may also dynamically change how many bins are used (1-100) in the histogram. This option is available from the Options menu. Changing the number of bins can dramatically change the shape of the histogram, play around with it to get a feel for the true distribution of the data.
