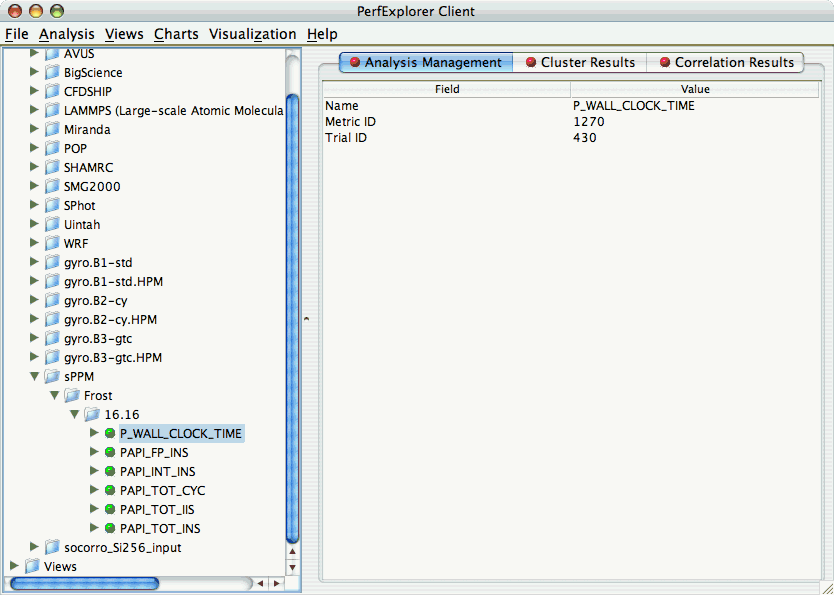
To perform cluster analysis, you first need to select a metric. To select a metric, navigate through the tree of applications, experiments and trials, and expand the trial of interest, showing the available metrics, as shown in the figure below:
After selecting the metric of interest, select the "Do Clustering" item under the "Analysis" main menu bar item. The following dialog will appear:
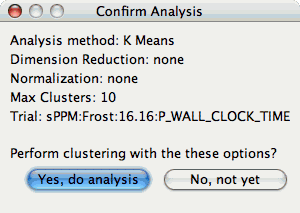
After confirming the clustering, the clustering will begin. When the clustering results are available, you can view them in the "Cluster Results" tab.
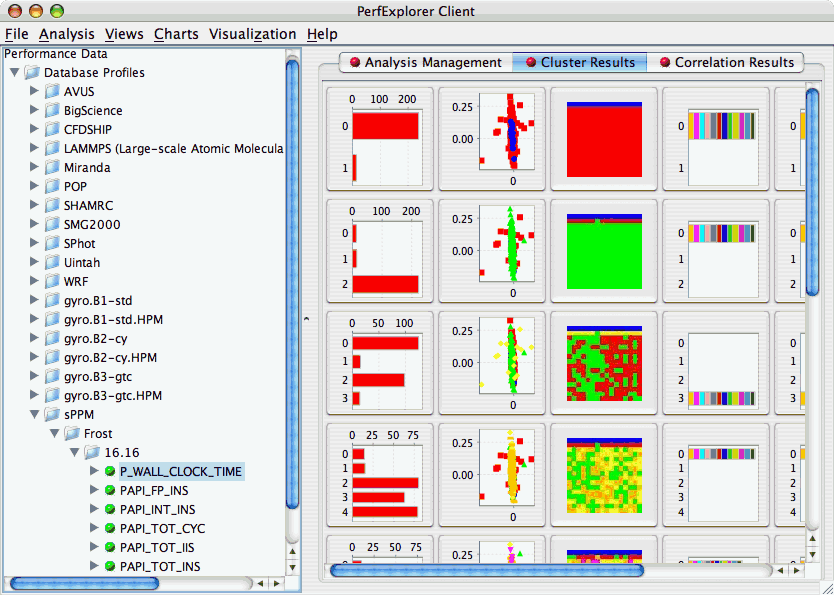
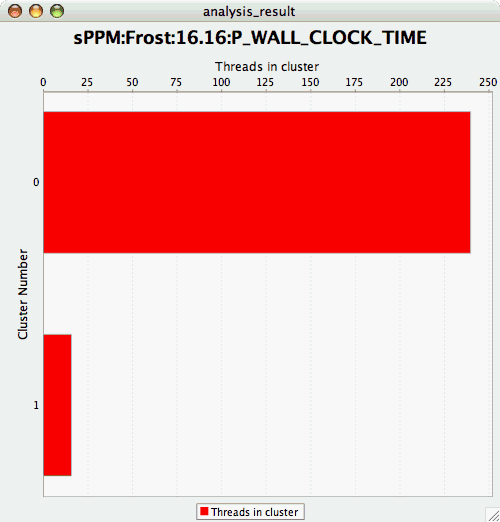
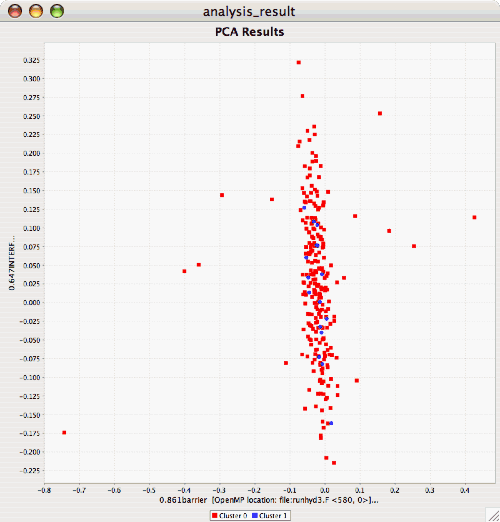
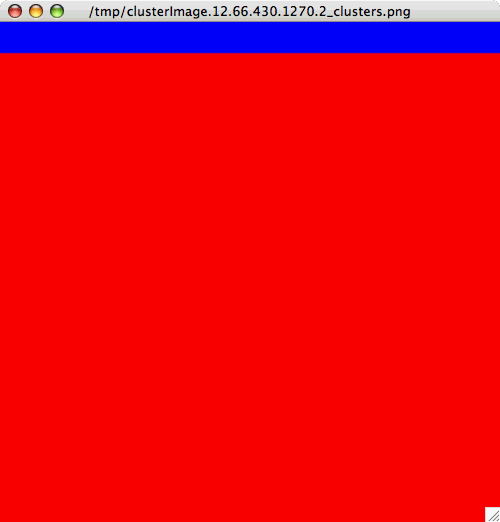
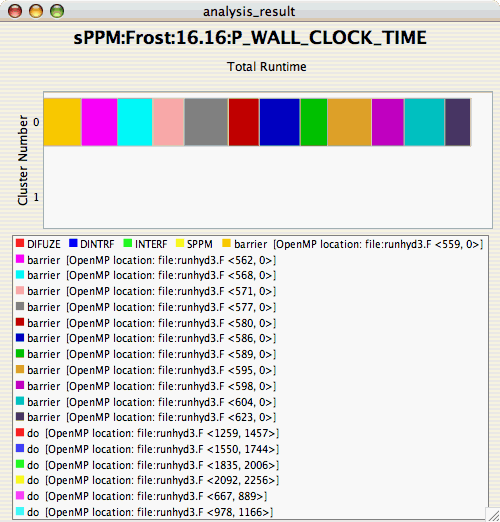
There are a number of images in the "Cluster Results" window. From left to right, the windows indicate the cluster membership histogram, a PCA scatterplot showing the cluster memberships, a virtual topology of the parallel machine, the minimum values for each event in each cluster, the average values for each event in each cluster, and the maximum values for each event in each cluster. Clicking on a thumbnail image in the main window will bring up the images, as shown below: