Performance Tools for Parallel Java Environments
Sameer Shende and Allen D. Malony 1
Department of Computer and Information Science, University of Oregon
{sameer,malony}@cs.uoregon.edu
Parallel Java environments present challenging problems for performance tools because of Java's rich language system and its multi-level execution platform combined with the integration of native-code application libraries and parallel runtime software. In addition to the desire to provide robust performance measurement and analysis capabilities for the Java language itself, the coupling of different software execution contexts under a uniform performance model needs careful consideration of how events of interest are observed and how cross-context parallel execution information is linked. This paper relates our experience in extending the TAU performance system to a parallel Java environment based on mpiJava. We describe the instrumentation model used, how performance measurements are made, and the overhead incurred. A parallel Java application simulating the game of life is used to show the performance system's capabilities.
Introduction
With the nascent use of Java for high-performance parallel and distributed computing comes the requirements from application developers and system managers for performance measurement and analysis tools. These are not new requirements, given performance as a dominant concern and the fundamental need for tools. Rather, the Java language environment and how it is used for high-performance computing pushes the state of performance technology in new respects. First, the Java Virtual Machine (JVM) presents a sophisticated shared memory execution platform that is multi-threaded, supports the mapping of user-level threads to system threads, allows just-in-time (JIT) compilation and dynamic loading of code modules, and interfaces with distributed systems middleware. Several of these execution features are new for performance tool research to consider. Second, the Java Native Interface (JNI) opens up the Java environment, making inter-language execution possible. This is important to gain access to high-performance application and communication libraries, but in doing so it complicates the ability to track consistently multi-level inter-language performance events across different execution contexts and to seamlessly integrate those events in local and global performance views. Lastly, because the Java language system is portable, the facilities, tools, and interfaces that support performance measurement and analysis for Java should be portable as well.
In this paper we share our experiences developing a prototype performance measurement and analysis system for Java. The system is built upon our robust TAU (Tuning and Analysis Utilities) performance framework for scalable parallel and distributed computing. TAU has been designed to support performance analysis for a general model of parallel computation. It provides portable measurement interfaces and services, flexible instrumentation, the ability to observe multiple software layers and levels of execution, and certain provisions for mixed-language programming. However, in all of these areas, TAU had to be extended in new ways to accommodate Java software features and the hybrid execution model it imposes. This experience has been valuable in that we believe such characteristics will be more the norm in the future and the techniques we developed will, hopefully, contribute to the repertoire of methods applied to these new performance technology challenges.
In the following section, we briefly describe the TAU framework and the general computation model it supports. We decided to focus our attention on a (cluster-oriented) style of high-performance computing that uses Java multi-threading for shared memory parallel computing on a symmetric multiprocessing (SMP) node and MPI message passing for communications between distributed nodes. Although not a comprehensive coverage of HPC Java environments, we feel this style of multi-level parallel Java programming is representative of current trends. In Sections 3, 4, and 5, we describe how the TAU framework has been adapted for this model. Following these sections, we show examples of performance analysis for a parallel Java application, highlighting the ability to capture performance information across execution levels and at different levels of parallelism. See Performance Measurement Overhead addresses the issue of instrumentation overhead and quantifies the costs of TAU measurements. In See Conclusions , we give conclusions and thoughts for future directions.
The TAU Performance Framework
The TAU performance framework [9] provides robust technology for performance instrumentation, measurement, and analysis for complex parallel systems [5]. It targets a general computation model initially proposed by the HPC++ consortium [3] . This model consists of shared-memory nodes where contexts reside, each providing a virtual address space shared by multiple threads of execution. The model is general enough to apply to many high-performance scalable parallel systems and programming paradigms. Because TAU enables performance information to be captured at the node/context/thread levels, this information can be flexibly mapped to the particular parallel software and system execution platform under consideration.
TAU supports a flexible instrumentation model that allows access to a measurement API at several stages of program compilation and execution. The instrumentation identifies code segments, provides for mapping of low-level execution events to high-level computation entities, and works with multi-threaded and message passing parallel execution models. It interfaces with the TAU measurement model that can capture data for function, method, basic block, and statement execution. Profiling and tracing form the two measurement choices that TAU provides. Performance experiments can be composed from different measurement modules, including ones that access hardware performance monitors. The TAU data analysis and presentation utilities are open, offering text-based and graphical tools to visualize the performance data as well as bridges to third-party software, such as Vampir [8] for sophisticated trace analysis and visualization.
Performance Instrumentation for Java
Scientific applications written in Java are often implemented using a combination of languages such as Java, C++, C and Fortran. While this defies the pure-Java paradigm, it is often necessary, as numerical, system, and communication libraries may not be available in Java and compiled native version can offer significant performance improvements. Analyzing such hybrid multi-language programs requires an instrumentation strategy that leverages instrumentation alternatives and APIs at several levels of compilation, linking, and execution. To illustrate this point, we consider instrumentation mechanisms employed for profiling and tracing Java programs that communicate with each other using the Message Passing Interface [6] .
While there are several projects that address a message communication interface for Java, we considered mpiJava [1] . mpiJava is an object-oriented interface to MPI that allows a Java program to access MPI entities such as objects, routines, and constants. While its API is implemented in a pure Java form, mpiJava relies on the existence of native MPI libraries; the API is implemented as a Java wrapper package that uses C bindings for MPI routines. 2 When a Java application creates an object of the MPI class, mpiJava loads a native dynamic shared object (libmpijava.so) in the address space of the Java Virtual Machine (JVM). This Java package is layered atop the native MPI library using the Java Native Interface (JNI) [10] . There is a one-to-one mapping between the Java methods and the C routines. Applications are invoked using a script file prunjava that calls the mpirun application for distributing the program to one or more nodes.
The Java execution environment with mpiJava poses several challenges to a performance tool developer. The performance model implemented by the tool must embed the hybrid-execution model of the system where multiple Java threads within a virtual machine and multiple MPI (native) processes execute concurrently. Performance data should be collected to highlight the different execution modes and the inter-relationship of the software layers. However, we want the instrumentation inserted in the application, virtual machine, and libraries to gather performance data in a uniform and consistent manner across different levels and language interfaces. This involves maintaining a common performance database for multiple sources of performance data within a context of execution. Events such as routine transitions, inter-task message communication and user defined events that occur at different locations can then be treated uniformly by the performance instrumentation when a core common API for performance instrumentation is used.
Below, we present our multi-level instrumentation approach for this parallel Java system using the TAU performance framework. TAU applies instrumentation at both the Java virtual machine level and the MPI library level to capture performance data and associate performance events.
Performance Instrumentation with JVMPI
Java 2 (JDK1.2+) incorporates the Java Virtual Machine Profiler Interface (JVMPI) [11] . JVMPI provides profiling hooks into the virtual machine and allows a profiler agent to instrument the Java application without any changes to the source code, bytecode, or the executable code of the JVM. JVMPI provides a wide range of events that it can notify to the agent, including method entry and exit, memory allocation, garbage collection, and thread start and stop; see the Java 2 reference for more information. When the profiler agent is loaded in memory, it registers the events of interest and the address of a callback routine to the virtual machine using JVMPI. When an event takes place, the virtual machine thread generating the event calls the profiler agent callback routine with a data structure that contains event specific information. The profiling agent can then use JVMPI to get more detailed information regarding the state of the system and where the event occurred.
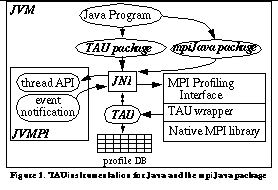
In See TAU instrumentation for Java and the mpiJava package , we consider a single context of a distributed parallel MPI Java program. At start-up, the Java program loads the mpiJava package as a shared object and the JVM loads the TAU performance measurement library as a shared object, which acts as a JVMPI profiling agent. A two-way function call interface between the JVM and the TAU profiler agent is established. The JVM notifies TAU of events and TAU can, in turn, obtain information about and control the behavior of the virtual machine threads using the JVMPI thread primitives (e.g., for mutual exclusion).
When the TAU agent is loaded in the JVM as a shared object, a TAU initialization routine is invoked. It stores the identity of the virtual machine and requests the JVM to notify it when a thread starts or ends, a class is loaded in memory, a method entry or exit takes place, or the JVM shuts down. When a class is loaded, TAU examines the list of methods in the class and creates an association of the name of the method and its signature, as embedded in the TAU object, with the method identifier obtained, using the TAU Mapping API (see the TAU User's Guide [12] ). When a method entry takes place, TAU performs measurements and correlates these to the TAU object corresponding to the method identifier that it receives from JVMPI. When a thread is created, it creates a top-level routine that corresponds to the name of the thread, so the lifetime of each user and system level thread can be tracked.
While performing measurements in a multi-threaded environment, TAU uses a common thread layer for operations such as getting the thread identifier, locking and unlocking the performance database, getting the number of concurrent threads, etc. This thread layer is used by the multiple instrumentation layers. When a thread is created, TAU registers it with its thread module and assigns an integer identifier to it. It stores this in a thread-local data structure using the JVMPI thread API described above. It invokes routines from this API to implement mutual exclusion to maintain consistency of performance data. It is important for the profiling agent to use the same thread interface as the virtual machine that executes the multi-threaded Java applications. This allows TAU to lock and unlock performance data in the same way as application level Java threads do with shared global application data. TAU maintains a per-thread performance data structure that is updated when a method entry or exit takes place. Since this is maintained on a per thread basis, it does not require mutual exclusion with other threads and is a low-overhead scalable data structure. When a thread exits, TAU stores the performance data associated with the thread to stable storage. When it receives a JVM shutdown event, it flushes the performance data for all running threads to the disk.
Performance Instrumentation with the MPI Profiling Interface
Given a means to capture Java-level execution events, we now consider MPI events. MPI provides an interface [6] that allows a tool developer to intercept MPI calls in a portable manner without requiring a vendor to supply proprietary source code of the library and without requiring the application source code to be modified by the user. This is achieved by providing hooks into the native library with a name-shifted interface and employing weak bindings. Hence, every MPI call can be accessed with its name shifted interface as well. Library-level instrumentation can be implemented by defining a wrapper interposition library layer that inserts instrumentation calls before and after calls to the native routines.
We developed a TAU MPI wrapper library that intercepts calls to the native library by defining routines with the same name, such as MPI_Send. These routines then call the native library routines with the name shifted routines, such as PMPI_Send. Wrapped around the call, before and after, is TAU performance instrumentation. An added advantage of providing such a wrapper interface is that the profiling wrapper library has access to not only the routine transitions, but also to the arguments passed to the native library. This allows TAU to track the size of messages, identify message tags, or invoke other native library routines. This scheme helps a performance tool track inter-process communication events. For example, it is possible to track the sender and the size of a received message in completion of a wild-card receive call. Whereas JVMPI-based instrumentation can notify the profiling agent of an event such as a mpiJava method entry, it does not provide the agent with arguments that are passed to the methods. However, this information can be obtained using the TAU MPI wrapper library.
 [bigger image]
There are two major problems that we face in instrumenting a hybrid system composed of MPI contexts and Java threads within each context. The first involves how to expose the thread information to the MPI interface. The second involves how to provide MPI context information to the Java interface. It is necessary to address these problems so events can be tracked in the correct context and thread. To solve the first problem we decided to have the TAU instrumentation access its runtime thread API layer within the MPI wrapper. During configuration of TAU, both MPI and Java measurement modules are selected to be configured in the TAU system. As shown in See TAU instrumentation for Java and the mpiJava package , this lets the TAU library use JNI 1.2 routines to get access to the Java virtual machine environment associated with the currently executing thread within the JVM. It does so by using the virtual machine information stored by TAU when the in-process profiling agent is loaded by the virtual machine during initialization, as described in the previous section. Using the thread environment, the thread layer can invoke routines to access thread-local storage to access the current thread identifier, and invoke mutual exclusion routines from the JVMPI interface to maintain consistency of the performance data. This scheme allows events generated at the MPI or the Java layer to uniformly access the thread API.
 [bigger image]
To allow the Java instrumentation to access the correct node and context information, we instrument the MPI_Init routine to store the rank of the MPI process in a globally accessible data structure. The TAU instrumentation triggered by JVMPI event notification (see See TAU instrumentation for Java and the mpiJava package ) then accesses this MPI information in the same manner as instrumentation requests from any layer from any language. By giving access to the execution model information to all measurement and instrumentation modules in a well-defined, uniform manner, the performance framework can be extended with a minimal effort to additional libraries and new evolving execution models. A combination of instrumentation at multiple levels in TAU helps us solve the hybrid execution model instrumentation problem.
Performance Analysis for an Example Parallel Java Application
TAU supports both profiling and tracing performance analysis methodologies. Profiling presents the user with summary statistics of performance metrics while tracing highlights the temporal aspect of performance behavior, showing when and where events took place. To provide a sense of how TAU's capabilities can be applied to parallel Java applications, we present performance analysis of a mpiJava benchmark application that simulates the game of Life. We use a simple application and run it on four processors mainly for purposes of brevity and clarity in our discussion. However, it should be understood that TAU's capabilities can extend and scale in respect to the complexity and requirements of applications and system environments, including larger numbers of Java contexts and processors.
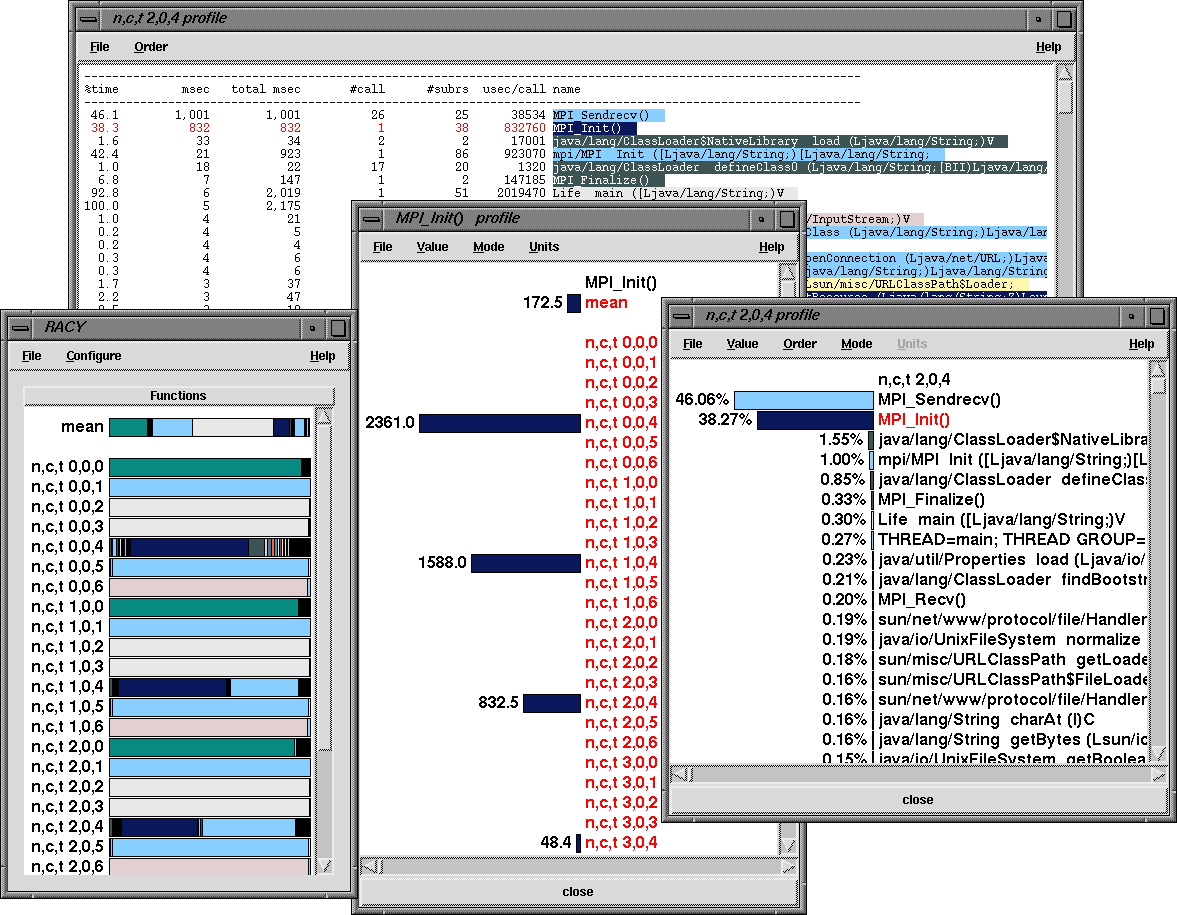
In See TAU's profile browser RACY shows per thread performance data. , we see the profile of the mpiJava Life application obtained from TAU measurement, implemented as described in the previous sections. It shows seven Java threads running on each node. Notice that events across different levels and components of execution are being observed. Thread 4 in each context is executing MPI calls for communication between the four processes. Of particular interest is the well-known cascading behavior of the mpich MPI_Init routine seen in the MPI_Init profile window. The performance of individual MPI routines is shown across each context and thread, as in the MPI_Init profile window. A detailed performance profile for each thread can be displayed graphically and textually, as shown in the two n,c,t 2,0,4 profile windows for (t)hread 4 in (c)ontext 0 on (n)ode 2. Some of the other threads are performing background JVM and mpiJava module tasks that the application developer would not directly see.
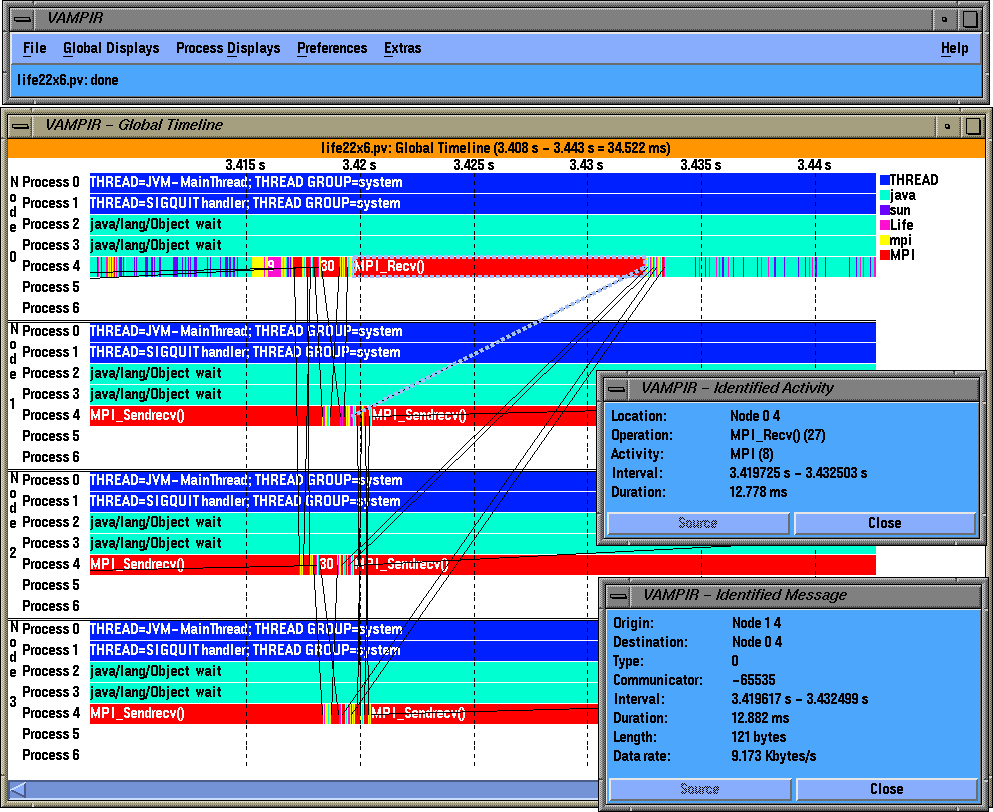
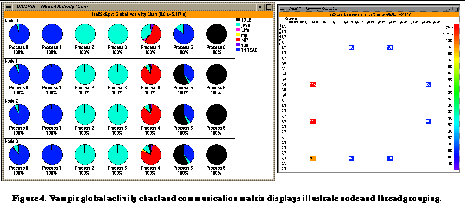
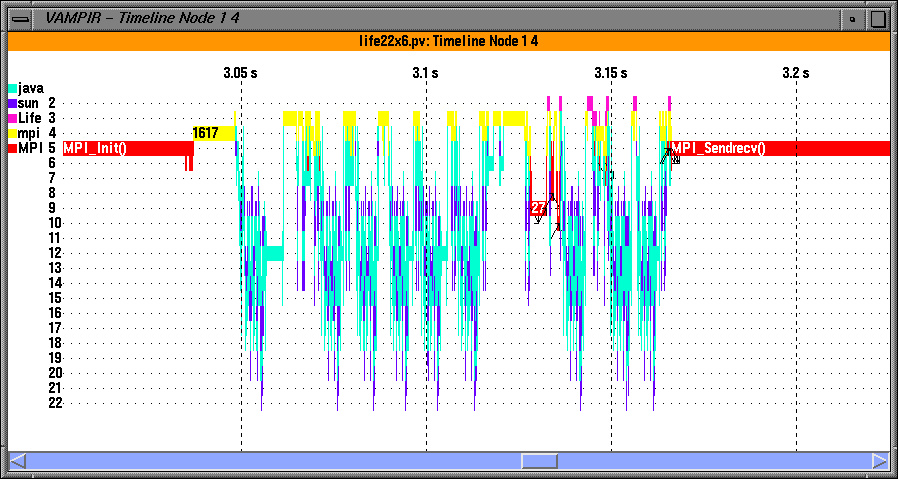
To observe dynamic performance behavior, TAU can also generate event traces that are visualized here using a third-party commercial trace visualization program called Vampir [8] . See Vampir global timeline display shows activities and inter-thread message communication illustrates how we can group threads within a node and show inter-thread, inter-node message communication events as line segments that connect the send and receive events within a global timeline. The user can zoom into interesting portions of the timeline and can click on a message or a segment to get more detailed information (e.g., the node where the events took place, the message tag, length, and bandwidth). Vampir provides a rich set of views for exploring different aspects of performance behavior. In See Vampir global activity chart and communication matrix displays illustrate node and thread grouping. , we see a communication matrix display with nodes and threads along the rows and columns marking the senders and receivers, and the color-coded values in the matrix that show the extent of inter-thread message communication. See Vampir dynamic calltree display on each thread shows the calling order annotated with performance metrics. shows a dynamic calltree on a selected thread. It shows the calling order of routines annotated with performance metrics (inclusive, exclusive times, and number of calls). A user can fold or unfold a segment of the tree to gain better insight. See Vampir timeline display can show the depth of routine nesting of the callstack on a particular thread. shows levels of nesting along a timeline in each thread. See Vampir global activity chart and communication matrix displays illustrate node and thread grouping. shows a summary of performance data grouped in higher level semantic groups (mpi, java, sun, and so forth) in the form of pie charts on a set of threads within each node. Each thread could be an application or a virtual machine level thread.
 [bigger image]
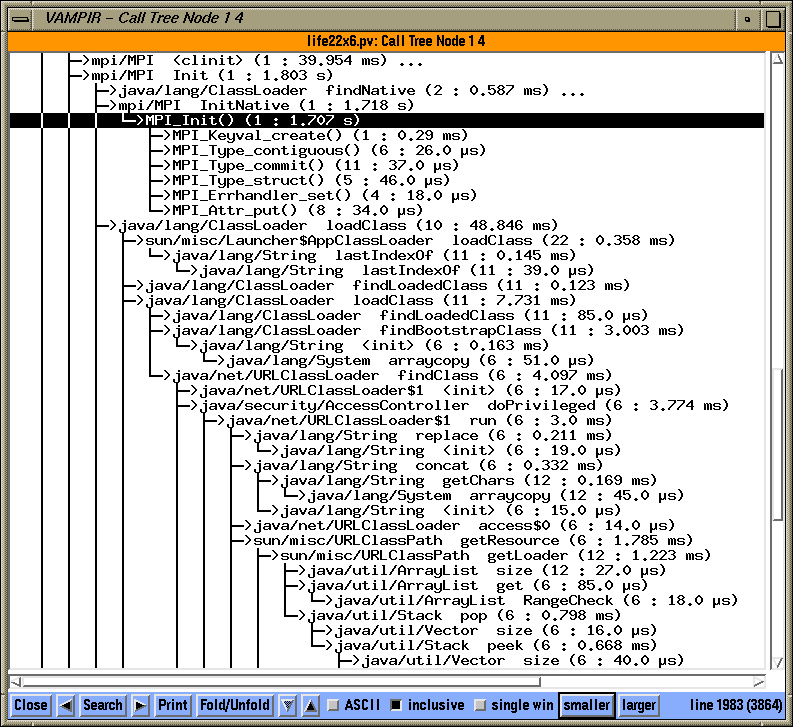 [bigger image]
Grouping performance data according to virtual machine and application level entities is not new. It has been successfully demonstrated in Paradyn-J [7] , a tool for detecting performance bottlenecks in interpreted, just-in-time compiled Java programs, where data is separately grouped in two distinct trees (one for the application, and another for the virtual machine). This approach allows both application developers as well as virtual machine developers to gain valuable information regarding the interaction between the two groups. In contrast, as illustrated in the performance displays, TAU gathers performance data from MPI and Java layers in a seamlessly integrated fashion, showing the precise thread where MPI calls execute and allowing data to be grouped in two hierarchies according to nodes and threads and semantic groups. While providing a set of displays for profiling and tracing data, we can see the need for other customized, user-defined multi-dimensional displays that may show data in more effective ways. To accomplish this, TAU provides an open, documented interface for accessing performance data that it generates and illustrates with examples how a user could transform the data to commonly used performance data formats.
Performance Measurement Overhead
Software-based instrumentation schemes have a runtime overhead that intrudes on application execution, possibly perturbing its performance [4] . It is impossible to completely eliminate this overhead, but it can be quantified and its effects evaluated to some extent. Here we characterize overhead that TAU generates in the execution of the Java application. Since TAU instrumentation is typically triggered at entry, exit, and initialization of methods, we break up the overhead in these three categories. We also consider the overhead when profiling is only enabled, and when profiling and tracing is selected.
 [bigger image]
As described earlier, TAU requires the use of JVMPI for performance measurement fro two reasons. First, it gives a convenient mechanism for observing method entry/exit events and other JVM actions. Second, even if an alternative instrumentation approach was used, such as directly in the Java source or in JNI-linked libraries, JVMPI is the only current mechanism to obtain thread information and JVM state data. In evaluating TAU overhead, we are concerned with both the absolute overhead as well as the relative overhead in contrast to the JVMPI overhead. Although a full characterization of JVMPI overheads is beyond the scope of this paper, our experience is that a JVMPI-enabled application (without any performance measurement) can see significant performance delays. Because TAU executes native code in the JVM address space, its efficiency should be high save for JVMPI interactions. If, in the future, the JVMPI capabilities that TAU utilizes are offered by some other, more efficient means, the substantial overhead of having JVMPI enabled may be avoided.
The experimental apparatus to quantify TAU measurement overhead is based on how classes are instrumented. Java supports dynamic loading of class bytecode in the virtual machine during program execution. This allows TAU to instrument only those classes that are loaded in the virtual machine, as opposed to all the classes. When a class is loaded, TAU examines the names of methods and creates timers for each method. To determine this cost of instrumenting a class, we can divide the time for loading a class by the number methods it contains to give an estimate of the fixed cost of method initialization. We measure all costs in terms of elapsed wall-clock time obtained by the system call gettimeofday. In a similar fashion, we measured overheads for method entry and method exit. All measurements take place after JVMPI calls the TAU profiler agent. Here we consider the standard time measurement where profile information is updated and trace data is optionally generated.
Table See TAU overhead for the parallel Java application Life shows the profiling overhead measurements in association with the overhead when tracing is also enabled. The overhead seen in this table does not include disk I/O for storing the profile information at the end of the application or for saving per-thread trace buffers. We compute the cost of the gettimeofday call on the system and compensate for it while measuring the overhead associated with method loading, entry, and exit. The TAU overhead for each method is different and is influenced by the time spent looking up the mapping table, string operations that depend upon the length of a method name, load on the system, and other platform specific parameters. However, we can compute average costs and give an estimate for a specific platform. From the table, we see that method loading costs 30.28 microseconds on the average, and it costs 2.67 microseconds for method entry and 1.16 for method exit during profiling. The costs are a little higher when we generate both profiles and event-traces. The measurements were made on a quad Pentium III Xeon/550 MHz, 3GB RAM symmetric multiprocessor machine with the following software environment:
- RedHat Linux 6.1 operating system with 2.3.40 Linux kernel,
- GNU gcc 2.95.2 C++ compiler that used the -O2 optimization flag, and
- Blackdown JDK 1.2.2 Java runtime environment (version Linux_JDK_RC3) that used the native threads package and the Sunw JIT compiler.
TAU currently does not employ any means for compensating for the perturbation caused by the instrumentation. General techniques for compensating for instrumentation perturbation are addressed in [4] .
Conclusions
As more applications for parallel and distributed systems are developed using portable hierarchical software frameworks, layered runtime modules, and multi-language software components, the requirements for integrated portable performance analysis will grow more complex. In particular, it becomes a challenge to observe performance events that occur throughout the software hierarchy and across language components and then relate those events to high-level execution abstractions and associated performance views.
Some of the challenges performance technologists face became apparent in our work with Java and its use in a MPI-based parallel execution environment. The extensions we made to the TAU system for unifying JVM versus native execution performance measurement, managing multi-level multi-threading, and utilizing different instrumentation mechanisms for Java and MPI demonstrate TAU's robust capabilities. However, there are deficiencies still present that we are intending to address, such as completing our work on a Java-level TAU API (see See TAU instrumentation for Java and the mpiJava package ) that will allow application events other than method calls and returns to be monitored. In the future, we also expect that new techniques for Java code parallelization will introduce new requirements for integrated performance instrumentation.
References
- M. Baker, B. Carpenter, G. Fox, S. Ko, and S. Lim. "mpiJava: An Object-Oriented Java interface to MPI," Proc. International Workshop on Java for Parallel and Distributed Computing, IPPS/SPDP 1999, April 1999.
- M. Baker, and B. Carpenter, "Thoughts on the structure of an MPJ reference implementation," Oct 1999, URL: http://www.npac.syr.edu/projects/pcrc/HPJava/mpiJava.html
- HPC++ Working Group, "HPC++ White Papers," Technical Report TR 95633, Center for Research on Parallel Computation, 1995.
- A. Malony, "Performance Observability," Ph.D. Dissertation, University of Illinois, Urbana. Available as CSRD Technical Report No. 1034, September 1990.
- A. Malony and S. Shende, "Performance Technology for Complex Parallel and Distributed Systems," Proc. Third Austrian-Hungarian Workshop on Distributed and Parallel Systems, DAPSYS 2000, "Distributed and Parallel Systems: From Concepts to Applications," (Eds. G. Kotsis and P. Kacsuk) to be published by Kluwer, Norwell, MA, pp. 37-46, 2000. URL: http://www.cs.uoregon.edu/research/paracomp/tau/papers.html
- Message Passing Interface Forum, "MPI: A Message Passing Interface Standard," International Journal of Supercomputer Applications 8, 1994. Special issue on MPI. URL: http://www.mpi-forum.org/docs/mpi-11-html/node152.html#Node152
- T. Newhall, "Performance Measurement of Interpreted, Just-in-Time compiled, and Dynamically Compiled Executions," Ph.D. Dissertation, University of Wisconsin, Madison, Aug. 1999. URL: http://www.cs.wisc.edu/~paradyn/
- Pallas GmbH, "VAMPIR - Visualization and Analysis of MPI Resources," 1998. URL:http://www.pallas.de/pages/vampir.htm
- S. Shende, A. D. Malony, J. Cuny, K. Lindlan, P. Beckman, S. Karmesin, "Portable Profiling and Tracing for Parallel Scientific Applications using C++", Proceedings of the SIGMETRICS Symposium on Parallel and Distributed Tools, pp. 134-145, ACM, Aug 1998. URL:http://www.cs.uoregon.edu/research/paracomp/tau/papers.html.
- Sun Microsystems, "Java Native Interface," Mar 2000, URL: http://java.sun.com/products/jdk/1.3/docs/guide/jni/index.html
- Sun Microsystems, "Java Virtual Machine Profiler Interface (JVMPI)," Dec. 1999. URL: http://java.sun.com/products/jdk/1.3/docs/guide/jvmpi/jvmpi.html
- University of Oregon, "TAU User's Guide," Nov. 1999. URL http://www.cs.uoregon.edu/research/paracomp/tau