The computation model above is general enough to apply to many high-performance architectures as well as to different parallel programming paradigms. Particular instances of the model and how it is programmed defines requirements for performance tool technology. For any performance problem, a performance framework to address the problem should incorporate:
We have developed the TAU performance framework as an integrated toolkit for performance instrumentation, measurement, and analysis for parallel, multithreaded programs that attempts to target the general complex system computation model while allowing flexible customization for system-specific needs.
 [bigger image]
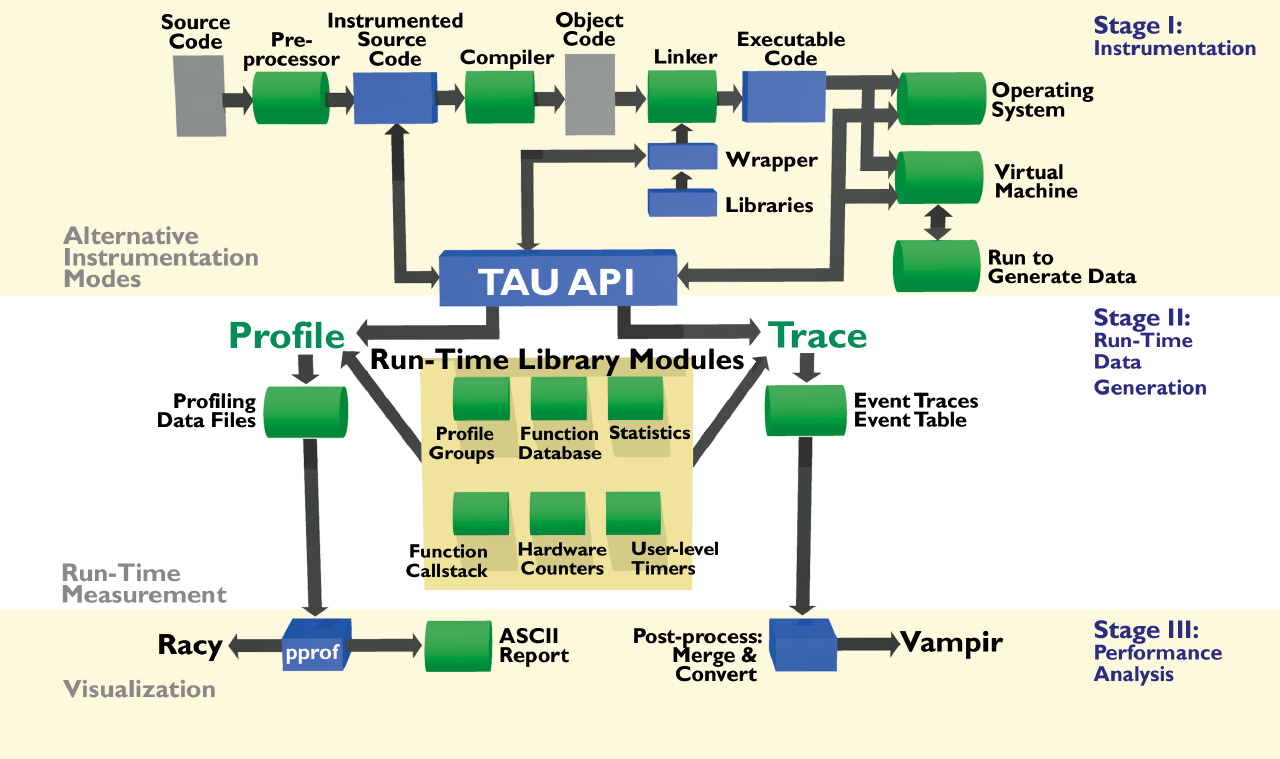
Figure: Architecture of TAU
The TAU performance framework [10] is shown in Figure 1.1 . It is composed of instrumentation, measurement, and visualization phases. TAU supports a flexible instrumentation model that allows the user to insert performance instrumentation calling the TAU measurement API at several levels of program compilation and execution stages. The instrumentation identifies code segments, provides mapping abstractions, and supports multi-threaded and message passing parallel execution models. Instrumentation can be inserted manually, or automatically with a source-to-source translation tool [13]. When the instrumented application is compiled and executed, profiles or event traces are produced. TAU can use wrapper libraries to perform instrumentation when source code is unavailable for instrumentation. Instrumentation can also be inserted at runtime, using the dynamic instrumentation system DynInst [7], or at the virtual machine level, using language supplied interfaces such as the Java Virtual Machine Profiler interface [11].
The instrumentation model interfaces with the measurement model. TAU's measurement model is sub-divided into a high-level performance model that determines how events are processed and a low-level measurement model that determines what system attributes are measured. The measurement captures data for functions, methods, basic blocks, and statement execution. Profiling and tracing are the two measurement choices that TAU provides. The API lets measurement groups be defined for organizing and controlling instrumentation. The measurement library also supports the mapping of low-level execution measurements to high-level execution entities (e.g., data parallel statements) so that performance data can be properly assigned. Performance experiments can be composed from different measurement modules, including ones that can measure the wall-clock time, the cpu time, or processor specific activity using non-intrusive hardware performance monitors available on most modern processors; TAU can access both PCL [9] and PAPI [14] portable hardware counter interfaces. Based on the composition of modules, an experiment could easily be configured to measure the profile that shows the inclusive and exclusive counts of secondary data cache misses associated with basic blocks such as routines, or a group of statements. By providing a flexible measurement infrastructure, a user can experiment with different attributes of the system and iteratively refine the performance of a parallel application.
The TAU data analysis and presentation models are open. Although TAU comes with both text-based and graphical tools to visualize the performance data collected in the previous stage, it provides bridges to other third-party tools such as Vampir [8] for more sophisticated analysis and visualization. The performance data format is documented and TAU provides tools that illustrate how this data can be converted to other formats.
An important component of the performance model presented in a tool is how its integration model provides composition and integration of its different components. The modules must provide well defined interfaces that are easy to extend. The nature and extent of co-operation between modules that may be vertically and horizontally integrated in the distinct layers defines the degree of flexibility of the measurement system.