 [bigger image]
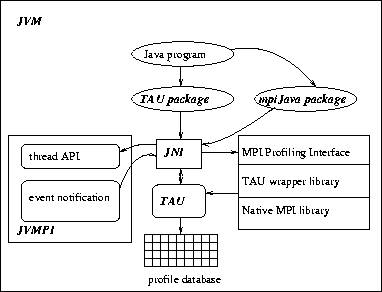
Figure 1: TAU instrumentation for Java source, virtual machine and mpiJava packages
Instrumenting Java and the JVM poses several difficulties. Conveniently, Java 2 (JDK1.2+) incorporates the Java Virtual Machine Profiler Interface (JVMPI) [16,15] which we have used for our work. JVMPI provides profiling hooks into the virtual machine and allows a profiler agent to instrument the Java application without any changes to the source code, bytecode, or the executable code of the JVM. JVMPI provides a wide range of events that it can notify to the agent, including method entry and exit, memory allocation, garbage collection, and thread start and stop; see the Java 2 reference for more information. When the profiler agent is loaded in memory, it registers the events of interest and the address of a callback routine to the virtual machine using JVMPI. When an event takes place, the virtual machine thread generating the event calls the profiler agent callback routine with a data structure that contains event specific information. The profiling agent can then use JVMPI to get more detailed information regarding the state of the system and where the event occurred.
 [bigger image]
Figure 1: TAU instrumentation for Java source, virtual machine and mpiJava packages
Figure 1 describes how JVMPI is use by TAU for performance measurement. Consider a single context of a distributed parallel MPI Java program. At start-up, the Java program loads the mpiJava package as a shared object and the JVM loads the TAU performance measurement library as a shared object, which acts as a JVMPI profiling agent. A two-way function call interface between the JVM and the TAU profiler agent is established. The JVM notifies TAU of events and TAU can, in turn, obtain information about and control the behavior of the virtual machine threads using the JVMPI thread primitives (e.g., for mutual exclusion).
When the TAU agent is loaded in the JVM as a shared object, a TAU initialization routine is invoked. It stores the identity of the virtual machine and requests the JVM to notify it when a thread starts or terminates, a class is loaded in memory, a method entry or exit takes place, or the JVM shuts down. When a class is loaded, TAU examines the list of methods in the class and creates an association of the name of the method and its signature, as embedded in the TAU object, with the method identifier obtained, using the TAU Mapping API (see the TAU User's Guide [11]). When a method entry takes place, TAU performs measurements and correlates these to the TAU object corresponding to the method identifier that it receives from JVMPI. When a thread is created, it creates a top-level routine that corresponds to the name of the thread, so the lifetime of each user and system level thread can be tracked.
To deal with Java's multi-threaded environment, TAU uses a common thread layer for operations such as getting the thread identifier, locking and unlocking the performance database, getting the number of concurrent threads, etc. This thread layer is then used by the multiple instrumentation layers. When a thread is created, TAU registers it with its thread module and assigns an integer identifier to it. It stores this in a thread-local data structure using the JVMPI thread API described above. It invokes routines from this API to implement mutual exclusion to maintain consistency of performance data. It is important for the profiling agent to use the same thread interface as the virtual machine that executes the multi-threaded Java applications. This allows TAU to lock and unlock performance data in the same way as application level Java threads do with shared global application data. TAU maintains a per-thread performance data structure that is updated when a method entry or exit takes place. Since this is maintained on a per thread basis, it does not require mutual exclusion with other threads and is a low-overhead scalable data structure. When a thread exits, TAU stores the performance data associated with the thread to stable storage. When it receives a JVM shutdown event, it flushes the performance data for all running threads to the disk.