Instrumentation of multi-threaded MPI programs poses some challenges for tracking inter-thread message communication events. MPI is unaware of threads (Java threads or otherwise) and communicates solely on the basis of rank information. Each process that participates in synchronization operations has a rank. However, all threads within the process share the same rank. For a message send operation, we can track the sender's thread by querying the underlying thread system (in this case, through JVMPI) and we can track the receiver's thread likewise.
Unfortunately, there still exists a problem with MPI communication between threads in that the sender doesn't know the receiver's thread id and vice versa. To accurately represent a message on a global timeline, we need to determine the precise node and thread on both sides of the communication, either from information in the trace file or from semantic analysis of the trace file. To avoid additional messages to exchange this information at runtime or to supplement messages with thread ids, we decide to delay matching sends and receives to the post-mortem trace conversion phase. Trace conversion takes place after individual traces from each thread are merged. The merged trace is a time ordered sequence of events (such as sends, receives, routine transitions, etc.). Each event record has a timestamp, location information (node, thread) as well as event specific data (such as message size, and tags). During trace conversion, each record is examined and converted to the target trace format (such as Vampir, ALOG, SDDF or Dump). When a send is encountered, we search for a corresponding receive operation by traversing towards the end of the trace file and matching the receiver's rank, message tag and message length. When a match is found, the receiver's thread id is obtained and a trace record containing the sender and receiver's node, thread ids, message length, and a message tag can be generated. The matching works in a similar fashion when we encounter a receive record, except that we traverse the trace file in the opposite direction, looking for the corresponding send event. This technique is used later on in our example to produce Figure 3.
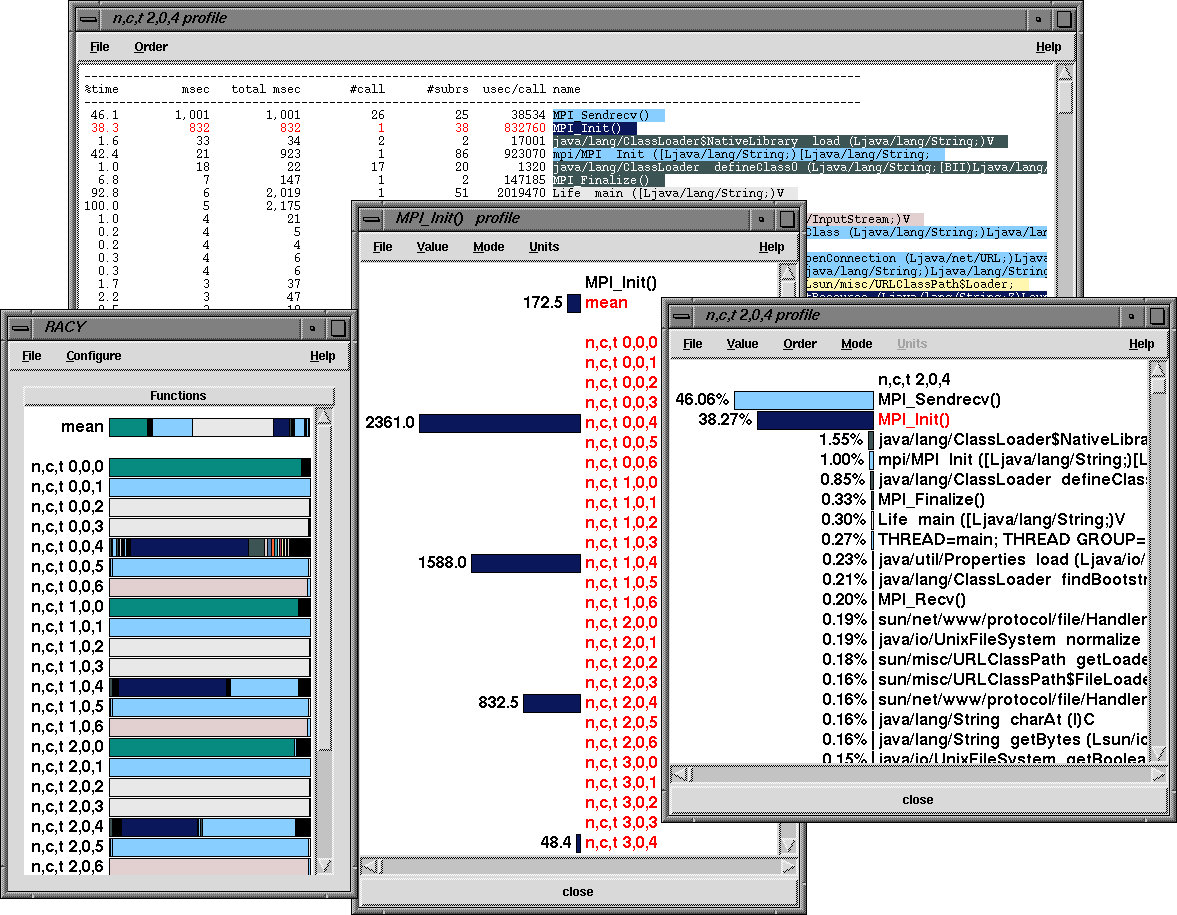
Figure 2: TAU's profile browser RACY shows per thread performance data
Figure 3: Vampir global time display shows activities and inter-thread message communication
Figure 4: Vampir timeline display can show the depth of routine nesting of the callstack on a particular thread
Figure 5: Vampir global activity chart illustrates thread grouping
 [bigger image]
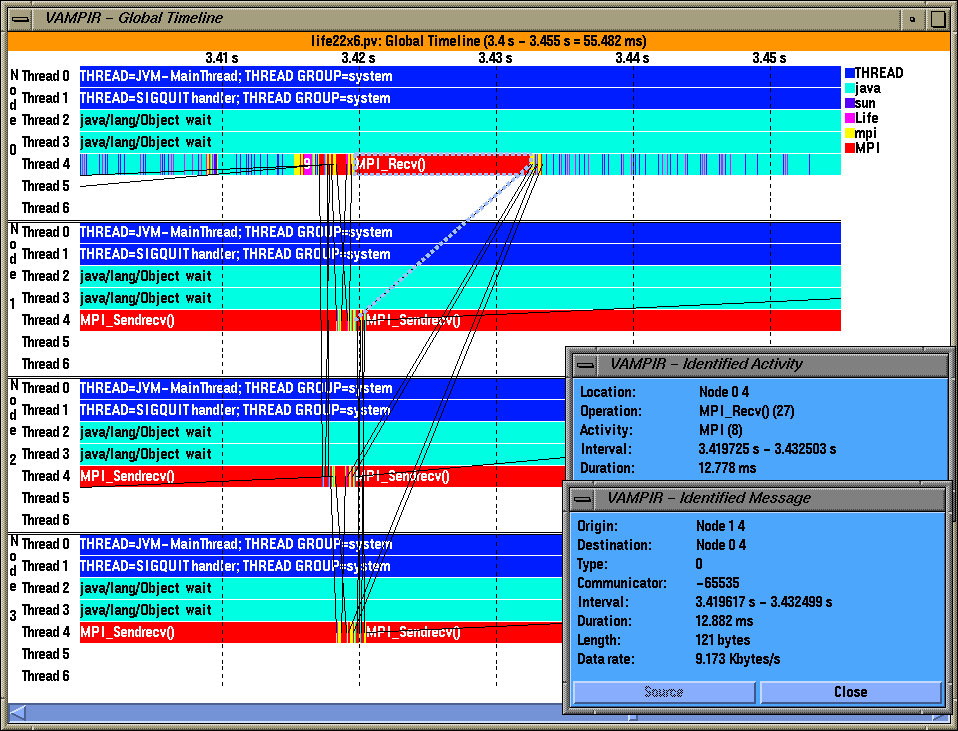 [bigger image]
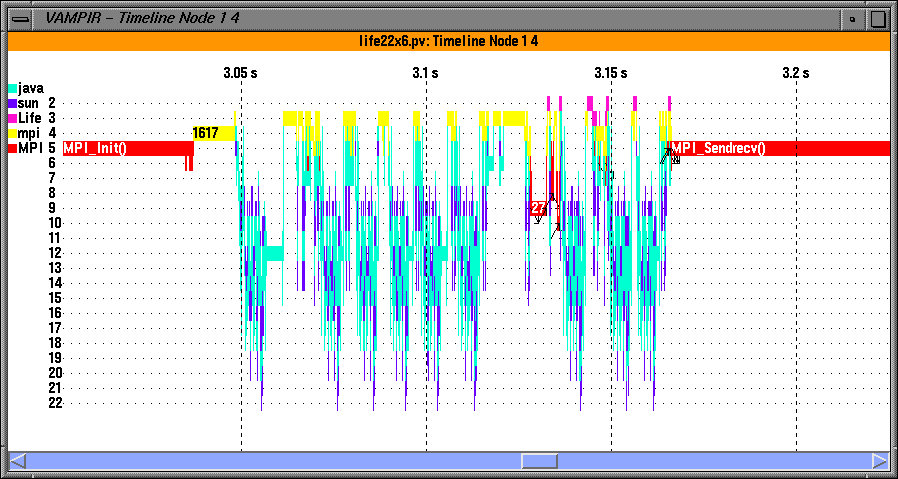 [bigger image]
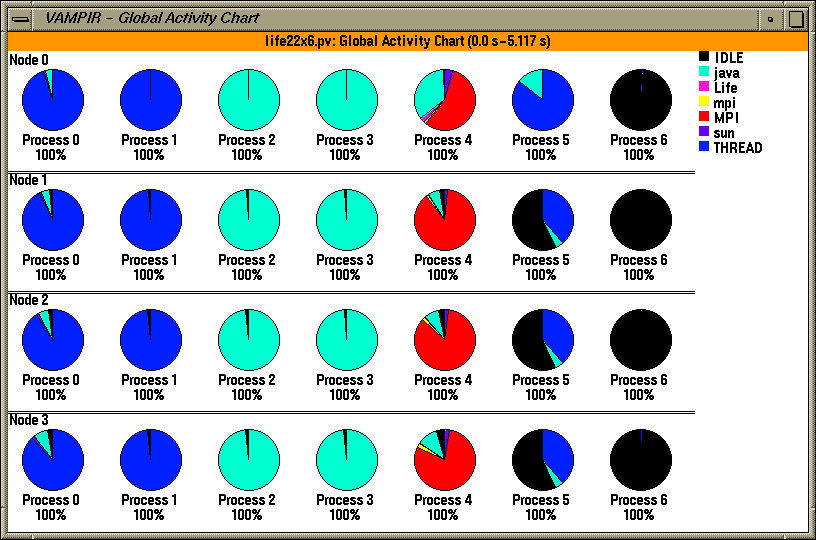 [bigger image]