The REMO weather forecast application from the DKRZ (Deutsches Klima Rechenzentrum, Germany) is an excellent testcase for the performance API. The code is instrumented using OPARI for OpenMP events and the MPI profiling library for MPI events. The measurement system uses the EPILOG tracing facility, with the POMP library calling EPILOG trace routines, as described above. The EXPERT system then processes the events traces and displays the performance analysis results.
In EXPERT, the presentation of the results is also based on three dimensions: performance problem, call graph, location. Each dimension is displayed using weighted trees. A weighted tree is a tree browser that labels each node with a weight. EXPERT uses the performance property's severity as this weight. The weight is displayed simultaneously using both a numerical value as well as a color coded icon. The color allows to identify nodes of interest easily even in a large tree. By expanding or collapsing any of the three trees it is possible to analyze the performance behavior of a parallel application on different levels of granularity.
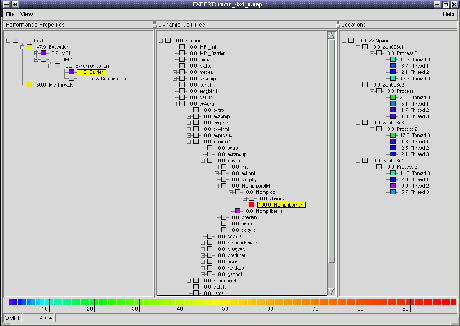
Figure 3: Barrier Performance Analysis of REMO
We see some of this interactive analysis in Figure 2 and 3. The three tree views are shown. The first view lists the different performance properties. The numbers at the nodes show the percentage of CPU allocation time spent on that property or lost as a result of that property. When the node is collapsed, the inclusive value is shown, when it is expanded only its exclusive value. Colors represent the numeric value graphically.
Figure 2 shows that 50% of CPU allocation time was lost as a result of sequential execution or was ``used by idle slave threads.'' Although idle threads do not execute any code, the idle time is mapped to the middle (call tree) view (i.e., the idle slave threads are considered to be executing the same code as the corresponding master threads). This allows the user to find code regions that spent a very long time on sequential execution. The numbers in the middle view refer to the selection in the left view, so 73.5% of the 50.0% are spent in /remo/ed4org/progec4.
The right view shows the distribution of idle times across the different threads. Here all values refer to the selection in the left neighbor, so the sum of all values correspond to the 73.9% from the middle view. Of course, only the slave threads have idle times, the master thread shows always 0.0%.
Figure 3 refers to the property ``OpenMP Barrier.'' The call tree shows that nearly all barrier time is spent on an implicit barrier (!$omp ibarrier) belonging to a parallel do (!$omp do). The distribution of overhead across the different threads is shown in the right view.
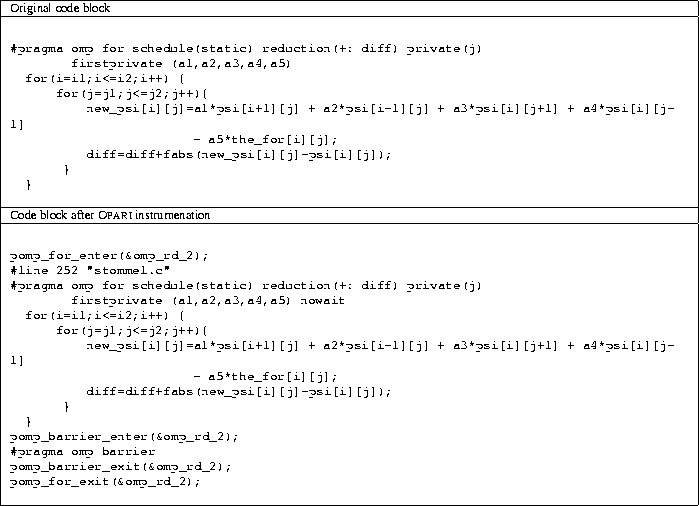
Table 4: Directive Instrumentation for Stommel Code.