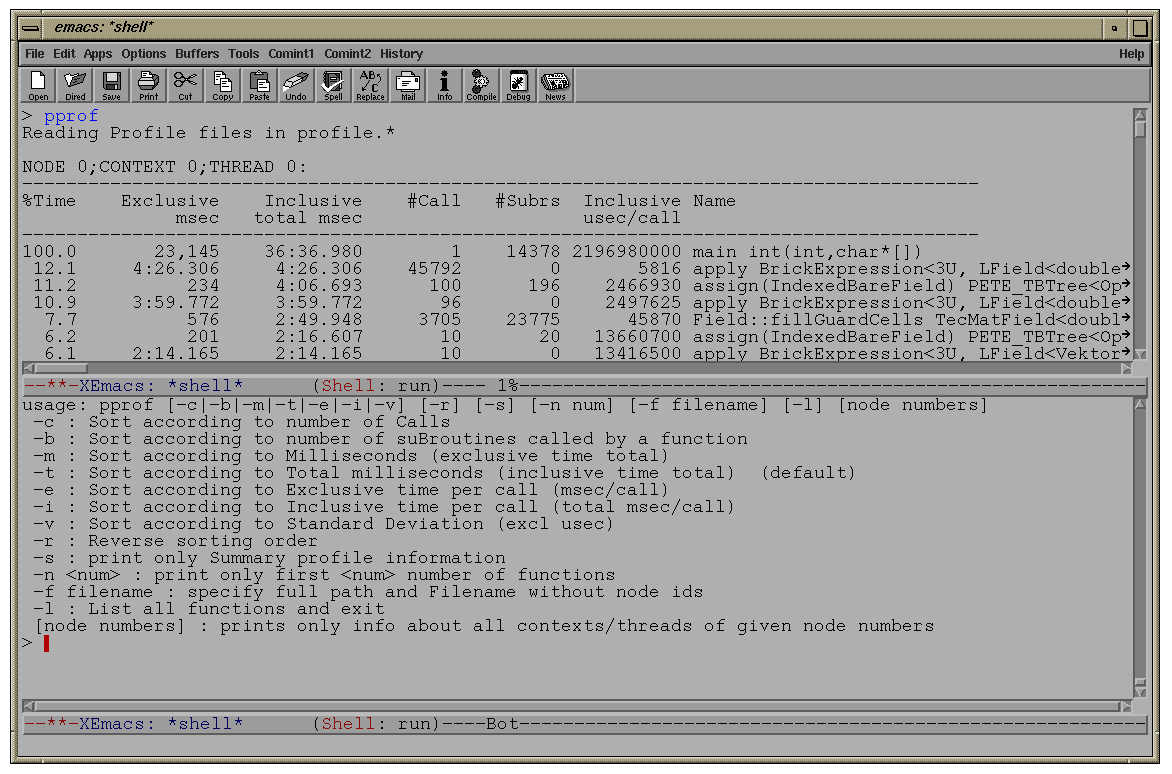
pprof is a parallel profile data display tool. It can be used to display the function and aggregate collection data for pC++, HPC++ and POOMA applications. It supports static and dynamic profiling displays. Pooma applications use dynamic profiling.
usage: pprof [-c|-b|-m|-t|-e|-i] [-r] [-s] [-n num] [-f filename] [-l] [node numbers] -c : Sort according to number of Calls -b : Sort according to number of suBroutines called by a function -m : Sort according to Milliseconds (exclusive time total) -t : Sort according to Total milliseconds (inclusive time total) (DEFAULT) -e : Sort according to Exclusive time per call (msec/call) -i : Sort according to Inclusive time per call (total msec/call) -v : Sort according to standard deViation (excl usec) -r : Reverse sorting order -s : print only Summary profile information -n num : print only first |
% pprof -eTo just display the names of all functions in profile files in directory
./data use
% pprof -l -f ./data/profile

The above figure shows pprof being used with a POOMA application highlighting PETE functions.