To illustrate the use of memory headroom analysis and phase-based profiling, we instrumented the Multiphase Flow with Interphase eXchanges (MFIX [21,22,23]) application. MFIX is developed at the National Energy Technology Laboratory (NETL) and is used for studying hydrodynamics, heat transfer and chemical reactions in fluid-solid systems. We ran a simulation modeling the Ozone decomposition in a bubbling fluidized bed [24].
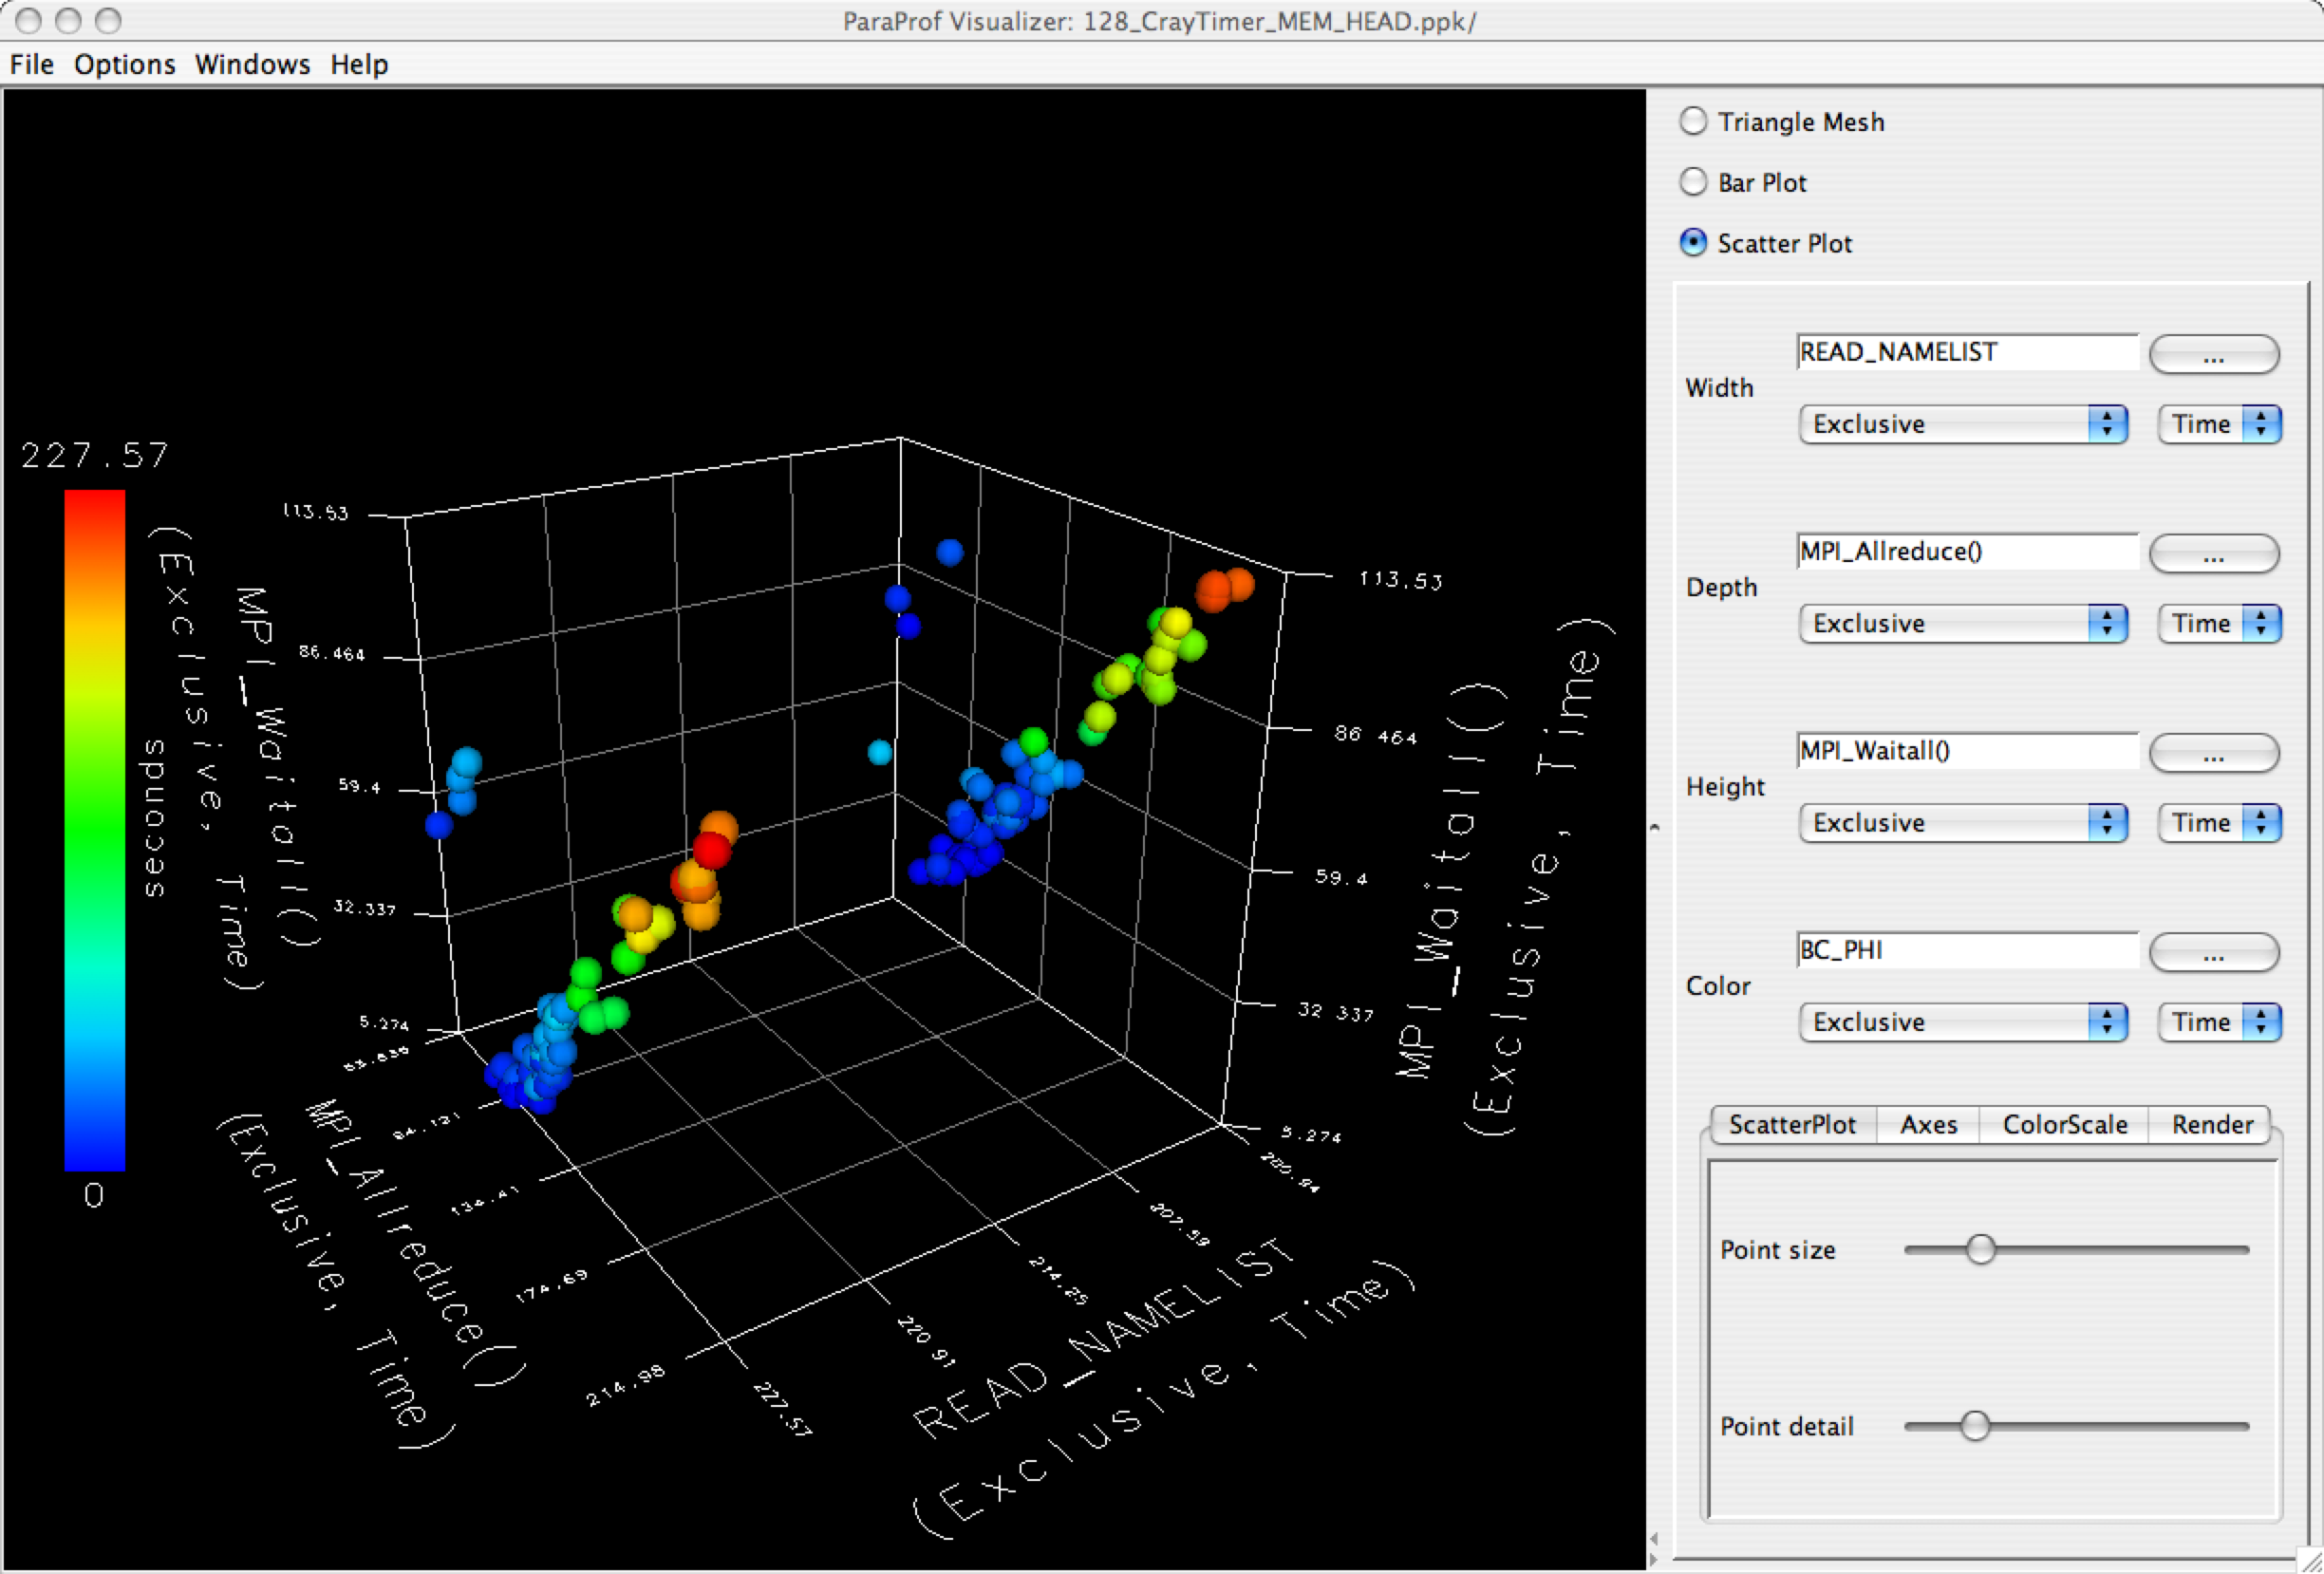
After instrumenting and running the application on 128 processors of the Cray XT3 at the Pittsburgh Supercomputing Center, we analyzed the performance data using the ParaProf profile browser. Figure 4 shows the aggregate profile of the application across all nodes. Figure 5 shows the average time spent in different routines and phases for all nodes. Figure 2 shows the minimum memory headroom available to each routine on node 0. This data reveals that when the MFIX application is loaded, 655 MB of memory headroom is available, this shrinks to 525 MB at the entry of the CALC_CELL routine. Figure 1 also highlights the memory headroom available. Figure 6 shows the relationship of the exclusive time spent in four routines for all processes in a four dimensional scatter plot. Each dimension in this scatter plot corresponds to a routine, metric pair. Each process is plotted with co-ordinates based on its values in these four routine metric pairs. We use this display to identify basic process clustering and patterns among processes. Using a combination of callpath profiles and memory headroom analysis, we are able to identify where the memory availability shrinks or grows to its lowest and the highest value. The parent of the given routine is responsible for memory allocation or de-allocation.