| Bernd W. Mohr, Allen D. Malony | Kesavan Shanmugam |
| Department of Computer and Information Science | Convex Computer Corp. |
| University of Oregon, Eugene OR 97403, USA | Richardson, TX 75083, USA |
| {mohr,malony}@cs.uoregon.edu | kesavans@convex.com |
Abstract.
Performance extrapolation is the
process of evaluating the performance of a parallel program in a
target execution environment using performance information
obtained for the same program in a different environment.
Performance extrapolation techniques are suited for rapid
performance tuning of parallel programs, particularly when the
target environment is unavailable. This paper describes one such
technique that was developed for data-parallel C++ programs
written in the pC++ language. In pC++, the programmer can
distribute a collection of objects to various processors and can
have methods invoked on those objects execute in parallel. Using
performance extrapolation in the development of pC++ applications
allows tuning decisions to be made in advance of detailed
execution measurements. The pC++ language system includes , an
integrated environment for analyzing and tuning the performance
of pC++ programs. This paper presents speedy, a new addition to
, that predicts the
performance of pC++ programs on parallel
machines using extrapolation techniques. Speedy applies the
existing instrumentation support of
to capture high-level event
traces of a n-thread pC++ program run on a uniprocessor machine
together with trace-driven simulation to predict the performance
of the program run on a target n-processor machine. We describe
how speedy works and how it is integrated into
. We also show
how speedy can be used to evaluate a pC++ program for a given
target environment.
Keywords: performance prediction, extrapolation, object-parallel programming, trace-driven simulation, performance debugging tools, and modeling.
Ideally, an integrated program analysis environment that supports performance debugging would include a means to predict performance where only limited access (if any) to the target system is given. The environment would measure only those performance data which is necessary, and use high-level analysis to evaluate different program alternatives under different system configuration scenarios. In this manner, the environment would enable performance-driven parallel program design where algorithm choices could be considered early in the development process [21]. The user would demand a level of detail from predicted performance analysis comparable to that provided by measurements; however, static prediction tools often cannot provide this. Similarly, the user will be frustrated if the time taken to generate predicted results is significantly greater than the time taken by measurement-based experiments, a problem often faced by simulation systems that analyze program execution at too low a level. For example, the Proteus system [3] and the Wisconsin Wind Tunnel [17] have considerably advanced the efficiency and effectiveness of dynamic prediction techniques for architectural studies, but the overhead is still too high to allow their use for rapid and interactive performance debugging.
In this paper, we describe a performance prediction technique that combines high-level modeling with dynamic execution simulation to facilitate rapid performance debugging. The technique is one example of a general prediction methodology called Performance Extrapolation that estimates the performance of a parallel program in a target execution environment by using the performance data obtained from running the program in a different environment. In [20], we demonstrated that performance extrapolation is a viable process for parallel program performance debugging that can be applied effectively in situations where standard measurement techniques are restrictive or costly. From a practical standpoint, performance extrapolation methods must address the problem of how to achieve the comparative utility and accuracy of measurement-based analysis without incurring the expense of detailed dynamic simulation, yet at the same time retaining the flexibility and robustness of model-based prediction techniques. However, there remains the problem of how performance extrapolation can be seamlessly integrated in a parallel language system, where it both leverages and complements the capabilities of the program analysis framework.
We have integrated our performance extrapolation techniques into
the program analysis
environment for pC++, a data-parallel C++ language system.
In Section 2, we describe the pC++ language and
the features of
to
show how the environment can easily be
extended to support performance prediction of pC++ programs. The
performance extrapolation approach to pC++ prediction is
discussed in Section 3. In Section 4,
we show how the performance extrapolation techniques have been
integrated into
, in the form
of the speedy tool. We performed several experiments which we
used to validate Speedy's results (Section 5)
and to evaluate its use for program tuning (Section 6).
The paper concludes with a discussion on future work.
pC++ and its runtime system have been ported to several shared and distributed memory parallel systems, validating the system's goal of portability. The ports include the KSR-1, Intel Paragon, TMC CM-5, IBM SP-1 / SP-2, Sequent Symmetry, SGI Challenge, Onyx, and PowerChallenge, Cray T3D, Meiko CS-2, Convex SPP and homogeneous clusters of UNIX workstations using PVM and MPI. pC++ also has multi-threading support for running applications in a quasi-parallel mode on UNIX workstations; supported thread systems are Awesime [6], Pthreads, LWP, and the AT&T task library. This enables the testing and pre-evaluation of parallel pC++ applications in a familiar desktop environment. More details about the pC++ language and runtime system can be found in [1,12].
provides a collection of tools with user-friendly graphical
interfaces to help a programmer analyze the performance of pC++
programs. Elements of the
graphical interface represent objects
of the pC++ programming model: collections, classes, methods, and
functions. These language-level objects appear in all
tools. By
plan,
was designed and developed in concert with the pC++
language system. It leverages off pC++ language technology,
especially in its use of the Sage++ toolkit [2]
as an interface to the pC++ compiler for instrumentation and for accessing
properties of program objects.
is also integrated with the pC++
runtime system for profiling and tracing support. Because pC++ is
intended to be portable, the tools are built to be portable as
well. C++ and C are used to ensure portable and efficient
implementation, and similar reasons led us to choose Tcl/Tk
[15] for the graphical interface.
The
tools are implemented as graphical hypertools. While the
tools are distinct, providing unique capabilities, they can act
in combination to provide enhanced functionality. If one tool
needs a feature of another one, it sends a message to the other
tool requesting it (e.g., display the source code for a specific
function). With this design approach, the toolset can be easily
extended.
meanwhile has also been retargeted to other
programming environments, including HPF.
One important goal in 's
development was to make the toolset as
user-friendly as possible. For this purpose, many elements of the
graphical user interface are analogous to links in hypertext
systems: clicking on them brings up windows which describe the
element in more detail. This allows the user to explore
properties of the application by simply interacting with elements
of most interest. The
tools also support the concept of global
features. If a global feature is invoked in any of the tools, it
is automatically executed in all currently running tools.
Examples of global features include locating information about a
particular function or a class across all the tools.
![[FIGURE 1]](small1.gif)
Fig. 1.pC++ Programming
Environment and Tools Architecture
Figure 1 shows the pC++ programming environment and the
associated tools
architecture. The pC++ compiler frontend takes
a user program and pC++ class library definitions (which provide
the predefined collection types) and parses them into an abstract
syntax tree (AST). All access to the AST is done via the Sage++
library. Through command line switches, the user can choose to
compile a program for profiling, tracing, and breakpoint
debugging. In these cases, the instrumentor is invoked to do the
necessary instrumentation in the AST. The pC++ backend transforms
the AST into plain C++ with calls to the pC++ runtime system.
This C++ source code is then compiled and linked by the C++
compiler on the target system. The compilation and execution of
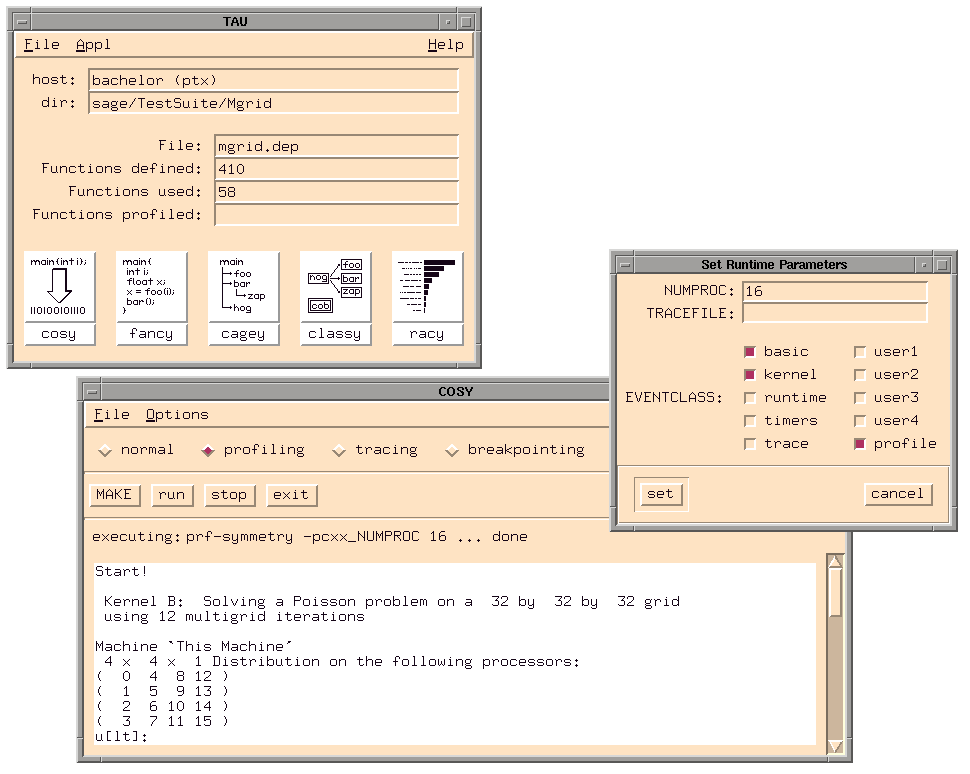
pC++ programs can be controlled by
cosy
(COmpile manager Status
displaY); see Figure 6, bottom.
This tool provides a graphical
interface for setting compilation and execution parameters. The
program and performance analysis environment is shown on the
right side of Figure 1. They include the
integrated
tools,
profiling and tracing support, and interfaces to stand-alone
performance analysis tools developed partly by other groups
[7,9,13,16].
The
toolset provides support both for accessing
static program information and for analyzing dynamic data
obtained from program execution.
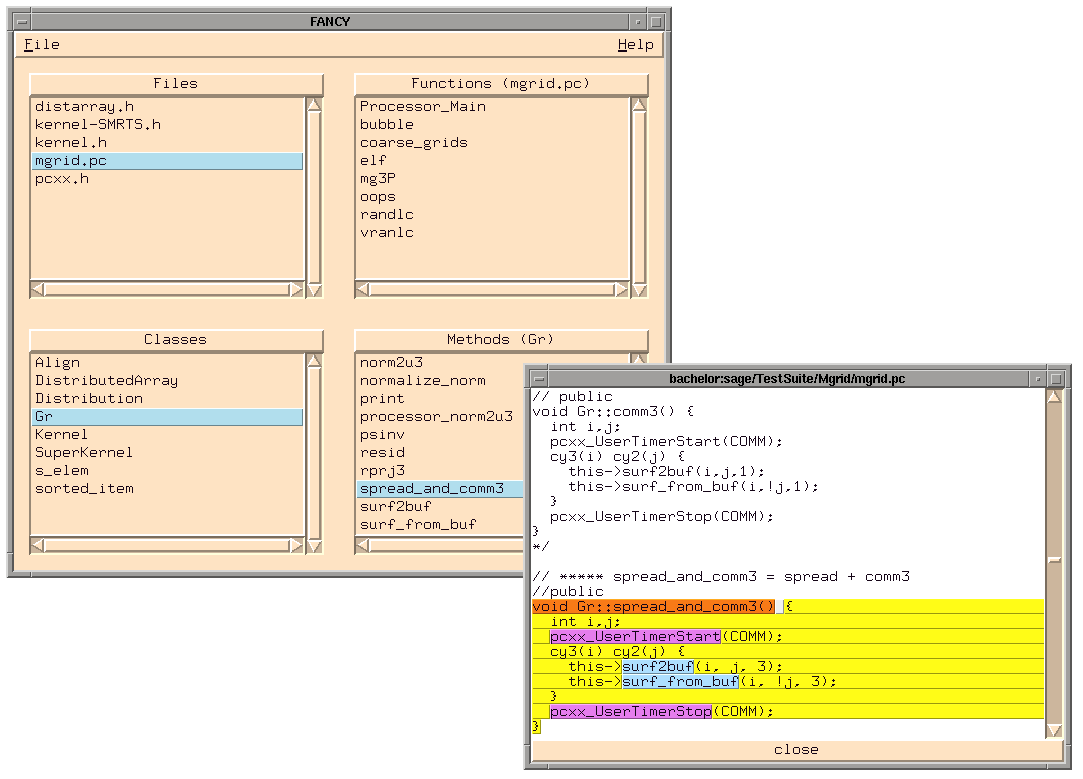
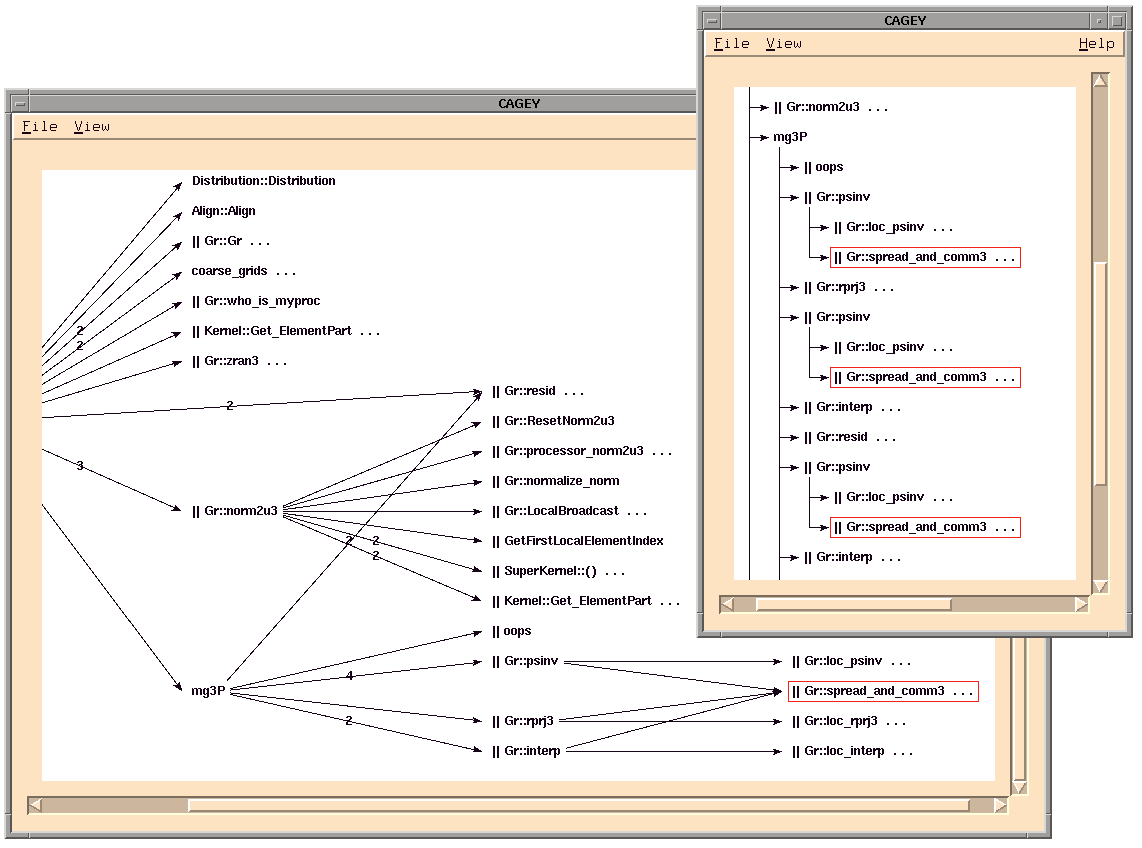
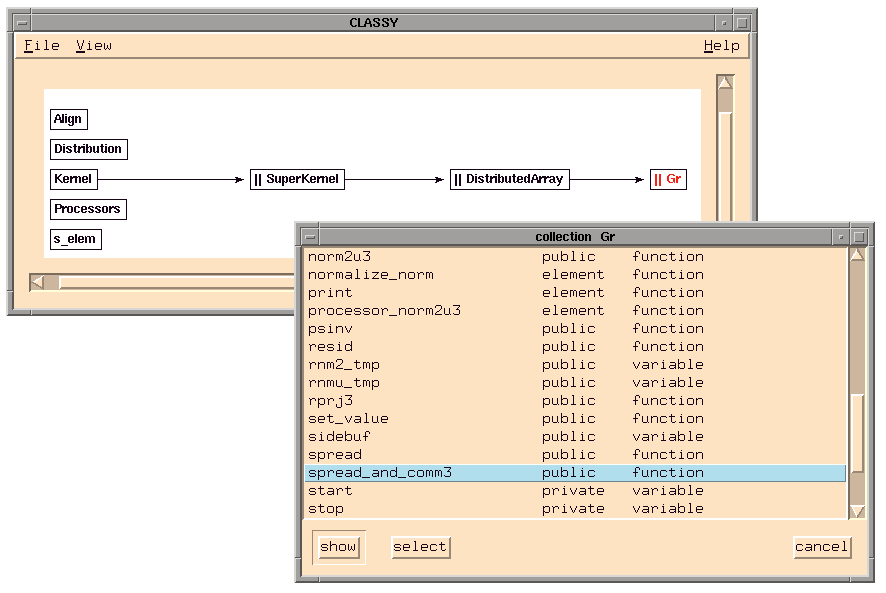
Currently,
provides three tools to enable the user to quickly
get an overview of a large pC++ program and to navigate through
it: the global function and method browser
fancy (File
ANd Class displaY), the static callgraph display
cagey
(CAll Graph Extended
displaY), and the class hierarchy display
classy (CLASS
hierarchY browser). The tools are integrated with the dynamic analysis
tools through the global features of
, allowing the user to
easily find execution information about language objects. For
instance, to locate the corresponding dynamic results (after a
measurement has been made), the user only has to click on the
object of interest (e.g., a function name in the callgraph
display).
's dynamic
tools currently include an execution profile data
browser called racy
(Routine and data ACcess
profile displaY), an
event trace browser called easy (Event And
State displaY), and a
breakpoint debugger called breezy (BReakpoint Executive
Environment for visualiZation and data
displaY). A more detailed
discussion of the
tools can be found in [4,12,14].
![[FIGURE 2]](small2.gif)
Fig. 2.Performance Extrapolation
The events are then sorted on a per thread basis, adjusting their timestamps to reflect concurrent execution. This is possible because the non-preemptive threads package switches the threads only at synchronization points, and because global barriers are the only synchronization used by pC++ programs. This imposes a regular structure to the trace file where each thread records events between the exit from a barrier and an entry into another without being affected by another thread. The sorted trace files look as if they were obtained from a n-thread, n-processor run, except that they lack certain features of a real parallel execution. For example, the timings for remote accesses and barriers are absent in these trace files. A trace-driven simulation using these trace files attempts to model such features and predict the events as they would have occurred in a real n-processor execution environment. The extrapolated trace files are then used to obtain various performance metrics related to the pC++ program. The technique is depicted in Figure 3. For more details refer to [18,19,20]. The next section explains the various models used for trace-driven simulation.
![[FIGURE 3]](small3.gif)
Fig. 3.A Performance Extrapolation Technique for pC++
![[FIGURE 4]](small4.gif)
Fig. 4.Remote Data Access Model
ExtraP uses a linear, master-slave barrier model to handle the barrier events. Thread 0 acts as the master thread while all the other threads are slaves. Every slave thread entering a barrier sends a message to the master thread and waits for a release message from the master thread to continue to the next data- parallel phase.The master thread waits for messages from all the slaves and then sends release messages to all of them. For distributed memory systems, the pC++ runtime system must continue to service remote data access messages that arrive at a processor even when the threads that run on that processor have reached the barrier. This is also true in the simulation. The parameters in the barrier model can be controlled so that hardware barriers or barriers implemented through shared memory can be represented. The linear barrier model delivers an upper bound on barrier synchronization times. We can easily substitute other barrier algorithms (e.g. logarithmic) if a more accurate simulation of barrier operation is required.
| Parameter | Description | Example |
|---|---|---|
| EntryTime | Time for each thread to enter a barrier. | 5.0 msec |
| ExitTime | Time for each thread to exit the barrier. | 5.0 msec |
| CheckTime | Delay incurred by the master thread every time it checks if all the threads have reached the barrier. | 2.0 msec |
| ExitCheckTime | Delay incurred by a slave thread every time it checks to see if the master has released the barrier. | 2.0 msec |
| ModelTime | Time taken by the master thread to start lowering the barrier after all the slaves have reached it. | 10.0 msec |
| BarrierByMsgs | 1 - use actual messages for barrier synchronization. The message
transfer time will contribute to the barrier time. 0 - do not use actual messages for barriers. |
1 |
| BarrierMsgSize | Size of a message used for barrier synchronization. | 16 |
Tab. 1. Parameters for the Barrier Model
All models described above have a variety of parameters that can
be tuned to match a specific target environment. For example,
Table 1 lists the parameters used in the barrier model and their
sample values. For a complete list of parameters, refer to
[18,20].
The next section explains how these parameters can be
set and the extrapolation experiment carried out using . A new
addition to
called speedy interacts with ExtraP to perform the
necessary extrapolation experiments. This integration of ExtraP
with
is import because ExtraP is intended to be used as part of
a program analysis environment to provide a performance debugging
methodology.
![[FIGURE 5]](large5.gif)
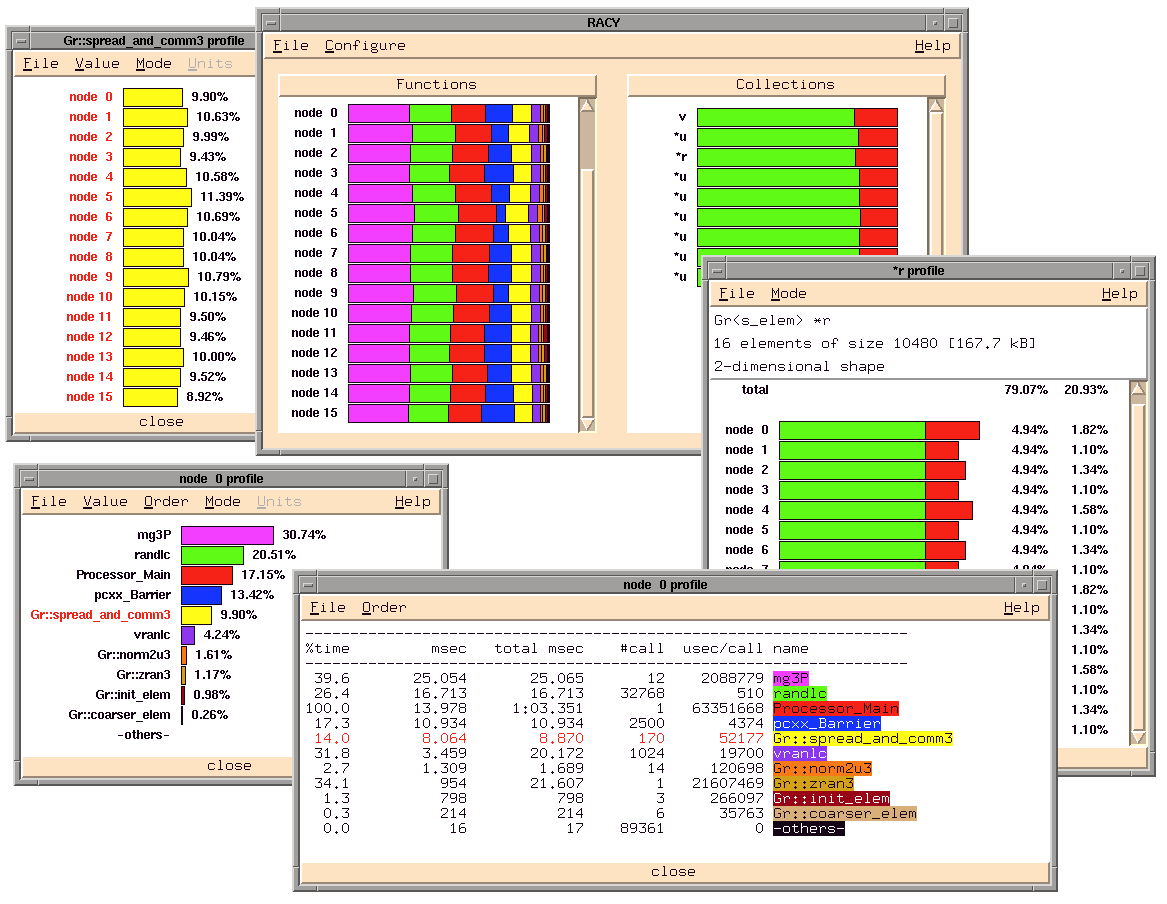
Fig. 5.RACY Performance Analysis Display for Poisson Benchmark
![[FIGURE 6]](large6.gif)
Fig. 6.TAU Main Control Window and COSY
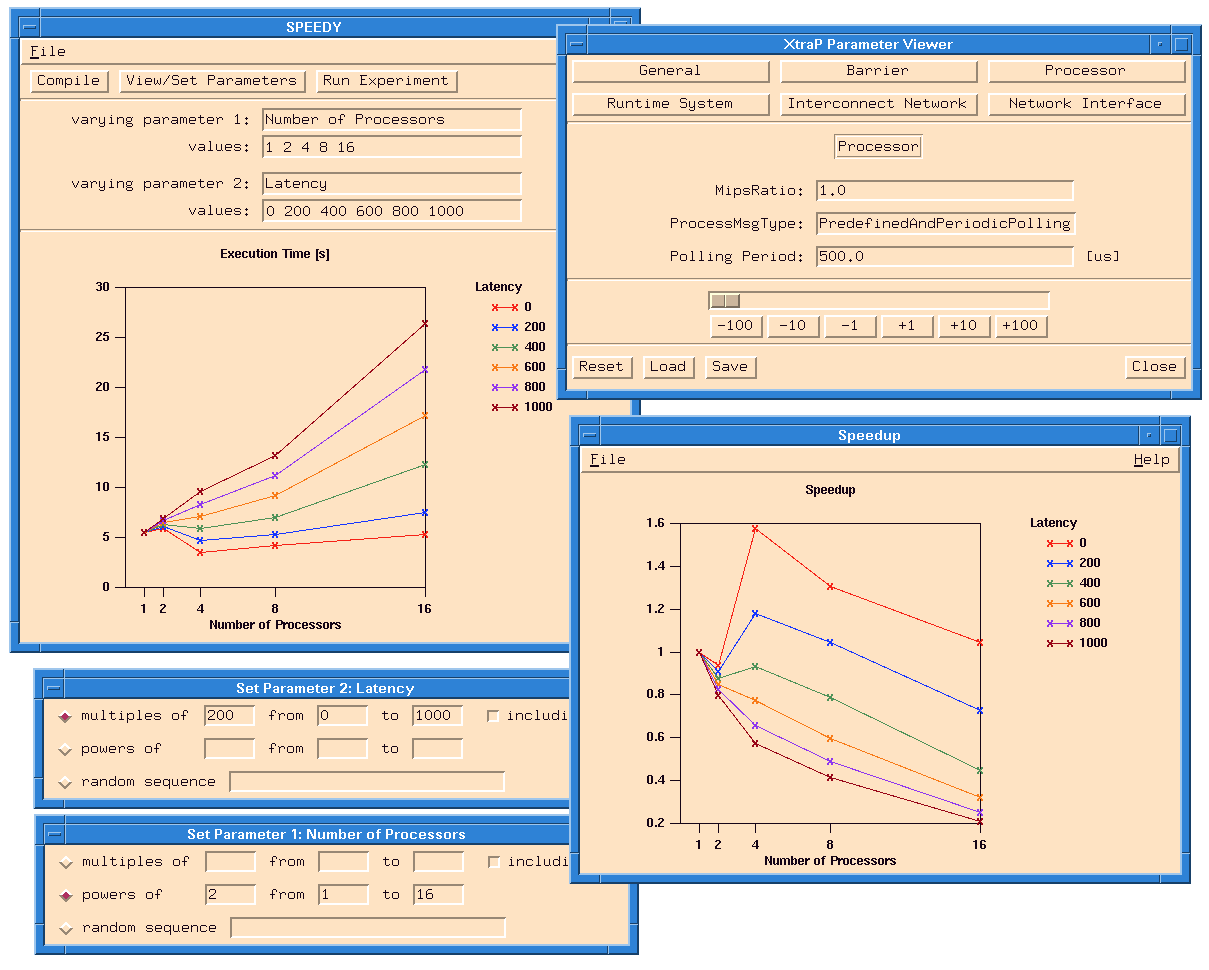
Second, the actual extrapolation experiments can be controlled
through a new
tool speedy
(Speedup and Parallel Execution
Extrapolation DisplaY). Pressing the
speedy button in the
main
control window (see Figure 6, top), brings up
its main control panel (see Figure 7).
Here, the user can control the compilation
of the specified pC++ object program, specify the parameters for
the extrapolation model and the experiment, execute the
experiment, and finally view the experiment results. Speedy uses
cosy (see Figure 6, bottom) for automatically
performing the necessary compilation, execution, trace processing, and
extrapolation commands. Speedy also automatically keeps track of
all parameters by storing them in experiment description files
and managing all necessary trace and experiment control files. By
loading a former experiment description file into speedy, the
user can re-execute the experiment or just reuse some of the
parameter specifications.
![[FIGURE 7]](large7.gif)
Fig. 7.SPEEDY Main Control Panel
In Figure 7, the user specified an complex
experiment where the
value of the parameter Number of Processors is stepping through
powers of two starting from one to thirty-two. In addition, the
parameter Latency should vary between 10 and 100 in steps of
10. After each iteration of the extrapolation, the execution time
as well as the speedup graph is updated. The user can also
perform smaller experiments by specifying a special value -NONE-
as the second or for both varying parameters.
The experiment and extrapolation model parameters can be entered
and viewed through the ExtraP parameter file viewer
(see Figure 8). Numerical parameters
can either be entered directly into the
input entry or manipulated through a slider bar and increment /
decrement buttons. Parameters with discrete values can be
specified through a pull-down menu (like ProcessMsgType in the
picture). In Figure 8, the viewer displays the
parameters associated with the modeling of the processor of the target
machine. Other modeling parameter groups can be displayed by
pressing one of the buttons in the top of the viewer window.
Besides the five parameter groups described in Section 3.3,
the group General allows the setting of parameters controlling the
generation and post-processing of the execution traces.
![[FIGURE 8]](large8.gif)
Fig. 8.ExtraP Parameter File Viewer
![[FIGURE 9]](small9.gif)
Fig. 9.Results from MatMul Program
The extrapolation clearly brings out the effect of data distribution on the execution time of MatMul. In addition to matching the general shape of the actual curves, the predicted curves also reasonably match the relative ranking of the different distributions. The extrapolation picks out the same best choice as the measurement for all number of processors except 32, in which case the execution time of the predicted best choice in the actual machine is within 3% of the optimum. This demonstrates that extrapolation can capture the relative performance ordering of algorithm design choices and, thus, can be used to make optimization decisions during the performance tuning process.
Concerning actual execution times, the predicted values differ somewhat from the measured values. Although they are not excessive, certain errors are expected, considering the fact that a high-level simulation has been performed to achieve these results. Our opinion is that the shape and relative positioning of the curves is more important. The trade-off in accuracy, of course, can be found in the utility and speed of extrapolation. The ability of extrapolation to predict the results very quickly without compromising the relative ordering of various design choices makes it very attractive in a rapid prototyping environment.
Our first experiment is designed to show how various design choices can be made using speedy. This can be easily seen in the MatMul matrix multiplication program we used for validating the speedy tool (see Figure 9, right). Using a (WHOLE/WHOLE) distribution for the data is obviously a bad choice. In general, the predicted results suggest to use a (BLOCK, WHOLE) distribution. The results also show that (BLOCK, BLOCK) wins if the number of processors is a perfect square which even beats (BLOCK, WHOLE) on 16 processors. Such crossover point information is very useful for the programmer during the development process.
![[FIGURE 10]](small10.gif)
Fig. 10.Predicted Results for Poisson
The goal of our next experiment is to show how speedy can be used
to selectively study various portions of the program. Such
profile information is useful when the programmer wants to tune
parts of the program for a particular machine. We used the pC++
version of the NAS benchmark Poisson as the test case. It is a
fast poisson solver which uses FFT based sine transforms together
with a cyclic reduction algorithm to solve PDEs. We used to
selectively instrument the code for the transforms and cyclic
reduction. After extrapolating the performance to a CM-5
architecture, speedy predicted the results shown
in Figure 10.
While the code for sine transforms scales up very well with a
speedup of 28.69 for 32 processors, the speedup curve for cyclic
reduction starts to flatten after 16 processors. A further study
of the trace files revealed that there are no remote accesses in
the sine transform part of the poisson solver which accounts for
its near-linear speedup. In contrast, the number of remote
accesses in cyclic reduction increases as the number of
processors thus affecting the performance badly. The overall
speedup for Poisson is predicted to be in between that of sine
transforms and cyclic reduction. This experiment tells us that to
improve the performance of Poisson, we must tune Cyclic reduction
first because it is the bottleneck. Speedy can be used in this
way to locate bottlenecks in a program. The performance behavior
observed using speedy is consistent with actual results [12].
Our future work will concentrate on making the ExtraP technology
more robust with additional models so that the different target
system environments can be better represented. We also intend to
extend the capabilities of the speedy tool to provide more
support for automated performance experimentation and to better
link the
analysis and visualization tools to the performance
data that ExtraP produces.
Documentation, technical papers, and source code for pC++,
Sage++, and
are available via FTP from
ftp://ftp.extreme.indiana.edu/pub/sage or via WWW at the URLs
http://www.extreme.indiana.edu/sage and
http://www.cs.uoregon.edu/paracomp/tau.