When considering techniques for online monitoring, there are several options available. In a traditional client/server model, interactions are typically synchronous between the requester of the data (the client) and the source of the data (the server). Excessive synchronization is likely to deteriotate application performance. In addition, monitoring performance data in an application with multiple threads/processes forces clients to manage interaction with, and data from, multiple servers. This makes client implementation unnecessarily complex.
Another option exists in our first implementation of the DAQV system [6]. Our primary objective was to simplify tool interaction with parallel applications by removing the need to interact with each process individually. That is, client tools could view a parallel application as a single entity and make logical requests for data from the global array structure defined by the collection of individual program arrays. This greatly simplified client development. We supported two modes of operation, push and pull. Under the push model, data was automatically delivered to the appropriate display tool as the program executed, according to routines inserted into the source code. This approach was very simple to use but not very flexible. To support more interactive array access, we implemented a pull model which allowed rudimentary control over program execution and runtime selection of the arrays to be visualized. However, both modes of operation required that the application program execution be suspended (by calling a DAQV routine). Thus, the perturbation caused by synchronization was still substantial.
In our most recent version, DAQV-II, we follow a similar abstract model that allows clients to view parallel applications as a single entity. But we also address the limitations of synchronous data access by using the metaphors of probe and mutate, which allows DAQV-II to support both synchronous and asynchronous data access. As mentioned above, for scenarios involving declared program data, we have, thus far, adhered to a synchronous approach. But realizing the potential for DAQV-like functionality beyond just accessing distributed program arrays (e.g., for accessing performance data or program monitoring), supporting asynchronous access was important. In this model, program execution may continue while a separate thread of control reads or writes the data of interest. The probe/mutate model removes the notion of synchronization from data access; it simply indicates the type (read/write) of access being performed.
The model supported by DAQV-II is particularly suitable for callstack monitoring. First, it allows asynchronous access and minimizes the synchronization overhead experienced by the application. Second, it supports a simple abstraction for interacting with parallel applications and eases the tool development process. Third, DAQV allows multiple client tools to access the ``global'' performance callstack simultaneously.
Adapting DAQV-II for use with TAU required only minor extensions. A routine for registering TAU performance data with DAQV was added, as was a new data distribution type to support TAU's performance callstack data. Nexus remote service request handlers were added to support the asynchronous data collection and transport. Client requests for data were able to use the existing application programming interface supported by the DAQV client library.
We use the DAQV-II framework to access the performance callstack and deliver the profile data to external analysis tools. Figure 2 shows how we have merged the DAQV-II framework with the TAU performance callstack measurements. Here, the performance callstacks for the parallel threads are distributed across the processing nodes in the parallel execution.
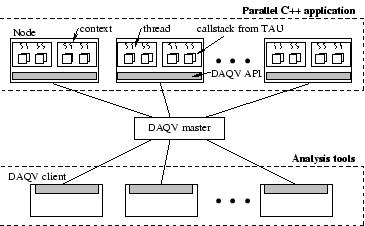
Figure 2: TAU-DAQV integration
DAQV-II allows this distributed callstack data to be described as a single global callstack array that can be requested by clients. The callstack data is collected in each thread when the TAU_MONITOR() routine is executed. This callstack data snapshot is then registered with the DAQV-II system. The registration process informs DAQV of the location and size of the data so that it may fill subsequent requests for it.
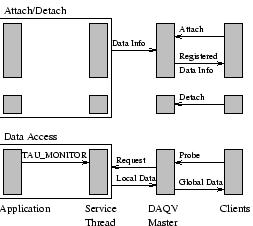
Figure 3 depicts a high-level view of the DAQV protocol as used with TAU. Clients attach to the DAQV master process and receive information about registered data. Later, clients send data requests to the master process, which forwards the requests to each of the DAQV slave threads. These threads send the registered callstack data to the master, which collects responses from all nodes and then forwards the global callstack to the client that requested it. The data is accessed asynchronously. DAQV need only ensure that the location and size of the registered callstack data is not changed while it is being accessed. This requires a small amount of locking to occur between the TAU_MONITOR() routine and the data access handler.
Thus, the parallel program does not need to perform a barrier operation, and it can continue to execute with minimal intrusion. The synchronization operations are off-loaded to the DAQV slave threads, which are responsible for communication with the master process; this further reduces the intrusion in the parallel program.
DAQV-II allows multiple clients to get callstack data simultaneously from the running program. Each client could perform a different analysis on the callstack data, present different views of the data, or implement different sampling intervals. For scientists who are geographically separated, DAQV-II facilitates collaborative monitoring by allowing them to attach, monitor the execution, and detach. The intrusion that accessing callstack data introduces in the parallel program is independent of the number of client monitors attached to the master.
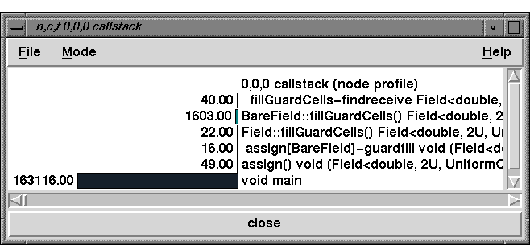
Figure 4: Callstack on node 0 of a POOMA 2D Diffusion equation simulation
Figure 4 shows the callstack view of a two dimensional diffusion equation which tracks the progression of the diffusion of a heat source on a mesh with respect to time. It was implemented using the POOMA [10] object oriented scientific computing framework.