Sort Program Execution: Dynamic Analysis


Next: Conclusion
Up: Program Analysis and Tuning
Previous: Compiling and Executing
Dynamic program analysis tools allow the user to explore and analyze
program execution behavior.
The most critical factor for the user during performance debugging is how
the high-level program semantics are related to the measurement results.
 helps in presenting the results in terms of pC++ language
objects and in supporting global features that allow the user to quickly
locate the corresponding routine in the callgraph or source text by simply
clicking on the related measurement result or state objects.
 's dynamic tools currently include an execution profile data browser
called racy (Routine and data ACcess profile displaY), an event trace browser called easy (Event And State displaY), and a breakpoint debugger called breezy.
To generate the dynamic execution data for these tools,
profiling and tracing instrumentation and measurement support has been
implemented in pC++.
In this paper, we concentrate on the racy tool.
The  execution profile tool racy provides a very simple and
portable means of understanding where a parallel program spends its time.
The initial display is a set of bar graphs for each processor showing
the percent of the execution time spent in each of the profiled routines in
the program.
To study the questions posed at the end of section 2, we
have run the program on a data set of 1024
 Pvector element objects
each containing a list of 1024 items; a total of  objects to sort.
We ran this on 16 nodes of a Silicon Graphics Challenge machine, and on 16
and 64 nodes of an Intel Paragon.
Recall that pC++ is completely portable, so all that was required to
compile for these two environments was to use the cosy tool to select
the appropriate system name; no source code needed to be modified.
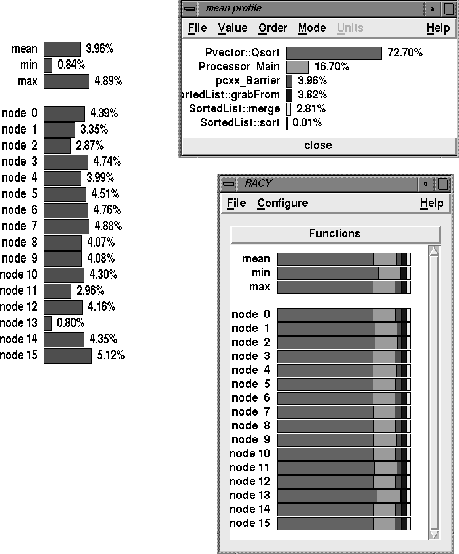
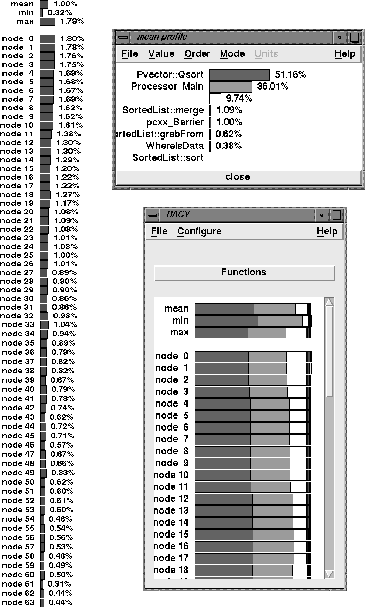
The results for the 16 node SGI and the 64 node Paragon are illustrated
in Figures 6 and 7.
There are three displays in each figure.
The processor profile bar graphs are shown in the lower right.
By using the mouse we selected the bar graph that describes the mean
profile shown at the top.
The result is given in the upper right display.
This version of the bar graph lists the names of each function and gives
the numerical percentage values of execution time.
Because we are also interested in the time spent in
the barrier synchronization we have asked racy to plot that for all
processors.
This data is shown by the chart on the left.
There are several interesting observations that we can make about
our sorting program from these displays.
First it is clear that the
time spent in the barrier synchronization routine is not large.
It is about 5 percent for the SGI and less that 2 percent for the Paragon.
One interesting observation about the Paragon numbers are that high-numbered
processors spend less time in the barrier than do low numbered processors.
The reason for this is uncertain.
Every aspect of the algorithm design is processor independent
and the runtime system design is relatively
symmetric with respect to processors (i.e. the barrier algorithm is
based on a tree reduction).
For the SGI, the time spent in the barrier is more random, relating to the
fact that processors are occasionally interrupted to carry out other tasks
as requested by the operating system.
The reader may notice that there is one difference between the SGI
and the Paragon displays.
In the Paragon version there is an extra
function that is profiled that is represented by a white bar and is
unlabeled in the upper right display.
This function is the pC++
poll loop which supports the global name space on the distributed
memory Paragon.
This is the third largest consumer of time at 9.74%.
In a distributed memory machine based on message passing, when a processor
wishes to ask for data from another processor it must send a message.
Because the Paragon does not support an active message interrupt,
it is necessary to have each processor periodically poll for incoming request
and service them.
In this case the profile information tells us that
each processor spends more time polling for incoming requests than it
does in asking for data (in the grabFrom function).
Hence, it may be possible to ``fine tune'' the runtime system so that it
polls less often.
What have we learned about our algorithm?
First, the barrier synchronization costs are relatively small, even though
the asymptotic analysis suggests that they may be a problem.
Second, we see that the largest cost is the time spent in the local
quicksort (72% of the time on the SGI and 51% of the time on the
Paragon).
This observation leads us to consider the third question posed at the end
of section 2: How significantly can the algorithm be improved by replacing
quicksort at each merge step with a local bitonic merge?
After making the experiments described above, we reprogrammed the algorithm
so that the call to the quicksort at the end of each merge step is replaced
by a call to a local bitonic merge operation.
The difference in performance was impressive.
The execution time of the original algorithm on 64 processors it was 30.13
seconds.
After the change to the merge function, this time dropped to 3.56 seconds.
On the SGI, the original version of the sort ran in time 47.4 seconds with
16 processors.
After the algorithm change it ran in 5.1 seconds.
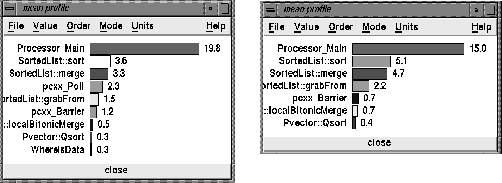
Again, from using racy to plot the mean profiles shown in
Figures 8 it is clear that the new algorithm is no more balanced
than before and only improvements in interprocessor communications will
make a significant difference in overall performance.

Figure 6: Performance Profiles from Racy on 16 node SGI Challenge

Figure 7: Performance Profiles from Racy on 64 node Paragon

Figure 8: The modified algorithm. On the left, the mean profile
showing total time spent in each function including the functions
it calls for 64 nodes on the Intel Paragon. On the right, the same
graph but for 16 nodes of the SGI Challenge.


Next: Conclusion
Up: Program Analysis and Tuning
Previous: Compiling and Executing
Bernd W. Mohr
Thu Jan 5 14:01:02 PST 1995
 helps in presenting the results in terms of pC++ language
objects and in supporting global features that allow the user to quickly
locate the corresponding routine in the callgraph or source text by simply
clicking on the related measurement result or state objects.
 objects to sort.
We ran this on 16 nodes of a Silicon Graphics Challenge machine, and on 16
and 64 nodes of an Intel Paragon.
Recall that pC++ is completely portable, so all that was required to
compile for these two environments was to use the cosy tool to select
the appropriate system name; no source code needed to be modified.


