S. Shende, A. D. Malony, J. Cuny, K. Lindlan, P. Beckman, and S. Karmesin:
Portable Profiling and Tracing for Parallel, Scientific Applications using
C++, Proceedings of SPDT'98: ACM SIGMETRICS Symposium on Parallel and
Distributed Tools, pp. 134-145, Aug. 1998.
Portable Profiling and Tracing for Parallel, Scientific Applications using C++
Abstract
Performance measurement of parallel, object-oriented (OO) programs requires the development of instrumentation and analysis techniques beyond those used for more traditional languages. Performance events must be redefined for the conceptual OO programming model, and those events must be instrumented and tracked in the context of OO language abstractions, compilation methods, and run-time execution dynamics. In this paper, we focus on the profiling and tracing of C++ applications that have been written using a rich parallel programming framework for high-performance, scientific computing. We address issues of class-based profiling, instrumentation of templates, runtime function identification, and polymorphic (type-based) profiling. Our solutions are implemented in the TAU portable profiling package which also provides support for profiling groups and user-level timers. We demonstrate TAU's C++ profiling capabilities for real parallel applications, built from components of the ACTS toolkit. Future directions include work on runtime performance data access, dynamic instrumentation, and higher-level performance data analysis and visualization that relates object semantics with performance execution behavior.
Keywords
Performance, profiling, tracing, C++
Introduction
In recent years, there has been a trend towards building high-performance, large-scale applications using object-oriented (OO) techniques and languages (primarily C++ and Java)
See Y. Ishikawa, R.R. Oldehoeft, J.V.W. Reynders, and M. Tholburn (Eds.), Scientific Computing in Object-Oriented Parallel Environments, Proc. ISCOPE97, LNCS Vol. 1343, Springer, Dec. 1997.
. Approaches include the creation of OO interfaces to existing numerical libraries
See J. Dongarra and L.S. Blackford, "ScaLAPACK tutorial," Proc. of Applied Parallel Computing, Industrial Computation and Optimization, Third International Workshop, PARA `96, Aug. 1996.
, the rewriting of libraries completely in OO form
See F. Bassetti, K. Davis, and D. Quinlan, "A Comparison of Performance-Enhancing Strategies for Parallel Numerical Object-Oriented Frameworks," Proc. ISCOPE 97, LNCS Vol. 1343, Springer, Dec. 1997.
, and the building of applications from a multi-layered, hierarchical OO component framework
See Advanced Computing Laboratory (LANL), "Scientific Template Library - Part of the DOE 2000 ACTS Toolkit," 1998. URL:http://www.acl.lanl.gov/SciTL/.
. Critics cite the inefficiencies of OO methods and language compilers, whereas proponents praise the ease of software construction, maintenance, and reusability. Here, we leave these arguments aside, and consider the nature of the tools that might support the development and analysis of parallel OO programs. Specifically, does parallel, OO programming differ in such fundamental ways from current practices that it requires new analysis techniques and tools? We believe that the answer is "yes" and, in this paper, we describe how these differences manifest themselves in profiling and tracing of C++ programs in a parallel execution framework.
Certainly, similar questions over the need for new analysis techniques and tools have arisen in other contexts (e.g., in different parallel programming paradigms, in the use of high-level parallel languages
See V.S. Adve, J.M. Crummey, M. Anderson, K. Kennedy, J. C. Wang, and D. A. Reed, "Integrating Compilation and Performance Analysis for Data-Parallel Programs," Proc. of the Workshop on Debugging and Performance Tuning for Parallel Computing Systems, Jan. 1996.
, or in the transition to metacomputing systems
See I. Foster and C. Kesselman, "Globus: A Metacomputing Infrastructure Toolkit," Proc. of the Workshop on Environments and Tools for Parallel Scientific Computing, Aug. 1996.
). These questions have, in fact, driven much of the evolution of parallel and distributed tools. With the widespread use of C++, however, one might assume that all such interesting issues have already been resolved, but this is not true for two reasons. Firstly, C++, as well as Java and other OO software technologies, is itself evolving and new features (e.g., templates) often create holes in tool support (e.g., template-based profiling). It is precisely these new features that are most important to the scientific application developers who use leading edge technology to build C++ libraries and frameworks. These programmers -- our user base -- see a constant need for new tool capabilities. Secondly, C++ is being tested for use in parallel and distributed execution at several different levels: runtime, library, system, and language. Much of this work is new and experimental, and, most importantly, much of it extends the object-oriented semantics of C++ to incorporate parallel abstractions. These new abstractions place demands on tools that go beyond those of sequential forms.
Specifically, our challenge was to build performance profiling and tracing tools for parallel, scientific applications written in C++ using leading edge technology.
We begin in Section 3 with a discussion of the parallel execution model used in our applications. In Section 4, we highlight some of the unique requirements in profiling parallel C++, such as class-based profiling, instrumentation of templates, runtime function identification, and polymorphic (type-based) profiling. In Section 5, we present the TAU C++ profiling system which has been incorporated into the ACTS C++ toolkit under development at Los Alamos National Laboratory. In Section 6, we present examples from its application to several different computational science codes. Finally, in Section 7, we state conclusions and outline future work.
Model of Computation
Our parallel C++ model of computation is based on that of HPC++Lib
See E. Johnson, D. Gannon, and P. Beckman, "HPC++: Experiments with the Parallel Standard Template Library," Proc. International Conference on Supercomputing, July 1997.
, an object-oriented library that supports both task- and data-parallel programming paradigms.
HPC++Lib features a Java-style thread class for shared memory architectures, a template library that supports synchronization, collective parallel operations, and remote memory references, and a remote invocation facility for member function calls on objects in remote address spaces. The runtime environment for HPC++Lib supports abstractions of nodes, contexts, and threads. A node is a shared-memory multiprocessor (SMP), having a coherent shared-address space that can be read and modified by any of its processors. Nodes can range from laptop computers to 128-processor SGI Origin 2000s; they can be connected via a network. A context refers to a virtual address space on a node that may be accessible to several different threads of control; for example, a Unix process is a context. It is possible to have more than one context per node.
The model supports two common modes of execution: "multi-threaded, shared memory" and "single program, multiple data (SPMD)." In the first case, the entire program runs in a single context with parallelism resulting from the dynamic creation of threads. Sets of threads and contexts can be bound into groups, and collective operations such as reductions and prefix operators can be applied to synchronize the threads of a group. In the second case, n copies of the same program are run on n different contexts, where each computation on a context can be multi-threaded. The synchronization mechanisms for thread groups extend to sets of thread groups running in multiple contexts. The SPMD computations need not be completely homogeneous: a program may have different numbers of contexts on different nodes, and those contexts may have different numbers of threads. Such an SPMD model, with multiple contexts and multiple threads within contexts, supports a range of applications with multi-level parallelism, such as adaptive grid methods for large scale simulation.
Profiling C++ Scientific Applications
Our application target was the ACTS C++ toolkit
See Advanced Computing Laboratory (LANL), "Scientific Template Library - Part of the DOE 2000 ACTS Toolkit," 1998. URL:http://www.acl.lanl.gov/SciTL/.
which imposed a number of requirements on our profiling and tracing tools. The ACTS toolkit is a group of parallel class libraries and scientific software frameworks. It provides a rich set of data parallel abstractions, exploiting advanced features of C++. Most significantly, one of its central components -- the POOMA framework
See J.V.W. Reynders et. al., "Pooma: A Framework for Scientific Simulation on Parallel Architectures," in G.V. Wilson and P. Lu (Eds.), Parallel Programming using C++, pp. 553-594, MIT Press, 1996.
-- makes extensive use of templates
See B. Stroustrup, The C++ Programming Language, Third Edition, Addison-Wesley, Massachusetts, June 1997.
to hide the mechanics of message passing behind data-parallel arrays. Our first two requirements are thus
-
Abstraction. Our tools must handle data-parallel abstractions, providing access to individual instantiation as well as aggregate behavior.
-
Completeness. Our tools must be able to report measurements for all aspects of C++ classes, including constructors, destructors, member functions, inlined functions, static members, and namespaces. It must be able to determine the virtual functions actually invoked at run-time, and it must be able to deal efficiently and flexibly with expression templates.
Also, the ACTS toolkit is designed to support the development of complex and long-running codes and, thus, optimization is important. Templates, in particular, would be too inefficient to be practical without aggressive optimization. Profiling and tracing instrumentation, thus, must not interfere with optimization. The measurement runtime overhead must be low, so as not to nullify performance gains, and it must be isolated to those functions and templates of interest to the developer. Disabled instrumentation should not incur significant runtime overhead and, in some sections of particularly sensitive code, must be possible to eliminate entirely. These considerations lead to the requirements of
-
Optimization. Our tools must have a low overhead and be able to run in the presence of optimization.
-
Selectivity. Our tools must support selective profiling of user-specified profile groups of functions.
Finally, the ACTS toolkit is intended to be used across a range of platforms, compilers, operating systems, and message passing libraries. Thus, our last requirement is
-
Portability. Our machines must run across multiple machines, compilers, operating systems, etc.
One of the more difficult problems in meeting these requirements was that of uniquely identifying functions and
templates in C++ at the source level. The instrumentation could use function pointers (addresses), but this information is not accessible in constructors and destructors. Also, since function pointers cannot be used directly to index tables containing profiling statistics, a hashing mechanism would be needed, resulting in additional runtime overhead. Assigning an integer at compile time to each profiled block would allow constant-time updating of statistics, but unique integers must be assigned to each unique template instantiation. This is difficult to do without sophisticated C++ parsing support, especially when working with multiple source files.
The solution we chose defines two objects - one static and one automatic - for each profiled block. The static object is initialized only once. Its constructor receives an identifying string (a function prototype of the profiled block) obtained from runtime type information (RTTI), and registers this information. The constructor and destructor of the non-static object receive a reference to the static object. This obviates the need to generate the function (block) identifier on every call. The second object is invoked on subsequent calls, and it executes the profiling routines, recording the statistics in the static object. When the profiling statistics must be reported, the global registry has a list of all the blocks that have been executed at least once.
This approach addressed many of our goals. It enables unique identification of template instantiations and virtual functions, improves runtime efficiency, allows multiple source files to be used, and supports completeness, profiling in the presence of optimization, and portability.
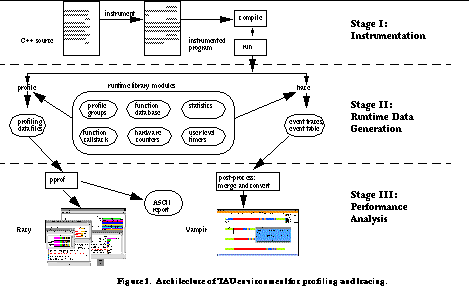
The TAU Portable Profiling and Tracing Package
A number of profiling methods exist: statistical sampling of the program counter or call stack; hardware counter sampling; instruction counting; and timer instrumentation. We use the last of these in TAU (Tuning and Analysis Utilities)
See B. Mohr, A. Malony, and J. Cuny, "TAU," in G.V. Wilson and P. Lu (Eds.), Parallel Programming using C++, MIT Press, 1996.
. The architecture of the TAU profiling package is shown in
See Architecture of TAU environment for profiling and tracing.
. We briefly describe its capabilities in terms of instrumentation, performance visualization, performance statistics, timers, hardware performance counters, selective profiling, and tracing.
Instrumentation
To precisely evaluate execution time of functions in a C++ program, the program must be instrumented with instructions at function entry and exit points. Instrumentation can be done at the source code level, or at the binary executable code level
See B. Miller, M. Callaghan, J. Cargille, J. Hollingsworth, R. Irvin, K. Karavanic, K. Kunchithapadam, and T. Newhall, "The Paradyne Parallel Performance Measurement Tools," IEEE Computer, Vol. 28, No. 11, pp.37-46, November 1995.
See Silicon Graphics, Inc., "Speed Shop User's Guide," 1997. URL:http://techpubs.sgi.com.
. We chose the source code level because of efficiency and portability concerns. Currently, our instrumentation is inserted manually using a profiling API
See Advanced Computing Laboratory(LANL), "TAU Portable Profiling," 1998. URL:http://www.acl.lanl.gov/tau.
.
To instrument, the user must specify the signature of each function to be profiled, and associate logically-related functions into profile groups. A function can belong to one or more profile groups. Once the groups have been identified, instrumentation macros are inserted into the code. For example,
int main (int argc, char **argv) {
TAU_PROFILE("main()",
"int (int, char **)",
TAU_DEFAULT);
... }
associates the function main() with the TAU_DEFAULT profile group. The TAU_PROFILE macro expands to the two profiling objects (static and automatic), as described above.
Profiling of templates requires another macro to determine type information:
template<class T1, class T2>
T1 foo (T1 x, T2 y, int z) {
TAU_TYPE_STRING (TAUstring,
CT(x) + " (" + CT(x) + ", " + CT(y) + ", int)" );
TAU_PROFILE("foo()",
TAUstring,
TAU_FIELD | TAU_IO);
... }
In the case where the function template is instantiated with [T1=double, T2=float], this constructs the string "foo() double (double, float, int)."
After instrumentation, the user configures TAU for profiling and compiles the application with PROFILING_ON defined. This overrides the default of null macro expansion, eliminating unnecessary runtime overhead when profiling is not desired. Finally, the user executes the application, generating output files named according to the HPC++ convention of profile.<node>.<context>.<thread>.
Profile Visualization
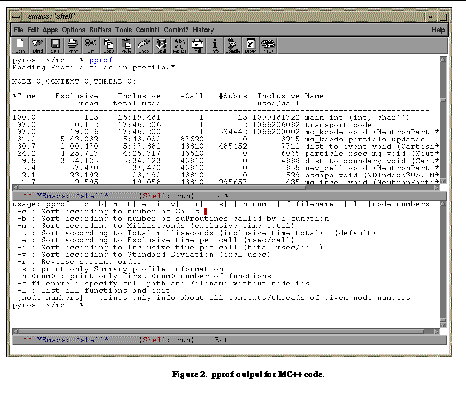
Once the performance data is obtained, we use the TAU toolset for its analysis. The examples shown here are from the MC++ application discussed in Section 6.1. The data was produced during a run on an 8-node SGI Origin 2000. Profiling data can be processed by a variety of tools. As seen in
See pprof output for MC++ code.
, pprof, a Unix prof-like tool, produces tabular output of the wall clock time and the fraction of total time. This can be displayed more graphically with the TAU tool Racy (Routine and Data Access Profile Display), as shown in
See Racy output for MC++ code.
,
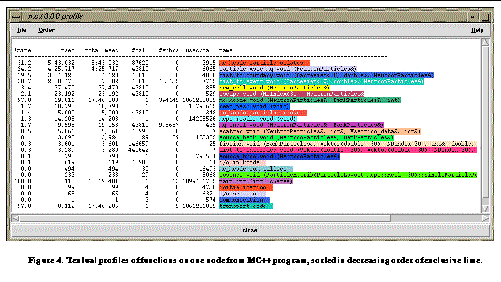
See Textual profiles of functions on one node from MC++ program, sorted in decreasing order of exclusive time.
, and
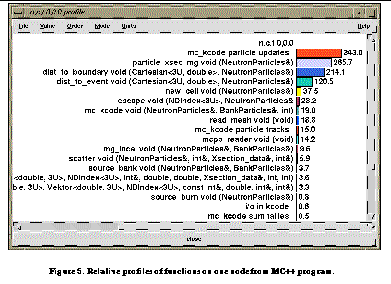
See Relative profiles of functions on one node from MC++ program.
.
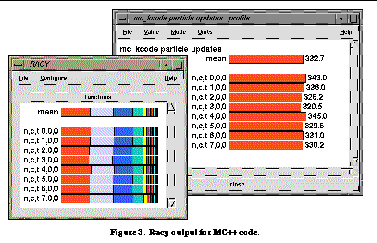
See Racy output for MC++ code.
shows aggregate parallel performance of a distributed object. It uses color-coded bar charts to show the mean time spent in each function across all nodes (forward window) and the amount of time spent on each node in a function of particular interest (back window).
See Textual profiles of functions on one node from MC++ program, sorted in decreasing order of exclusive time.
and
See Relative profiles of functions on one node from MC++ program.
show statistics for functions on a single processor, in this case Node 0.
See Textual profiles of functions on one node from MC++ program, sorted in decreasing order of exclusive time.
shows the textual profile for functions on Node 0. This profile lists the percentage of inclusive time for a routine on a node with respect to the total inclusive time on that node, the time spent exclusively and inclusively in each routine, the number of calls, the exclusive time per call in microseconds, etc. The msec column shows the cumulative, exclusive time summed over all invocations of the functions. Exclusive time refers to the total time spent in the function minus any time spent in other profiled functions that it called. Similarly, the total msec column shows inclusive time. It is the time spent from the entry point to the exit, summed over all invocations of the function when the function is not already on the callstack (to prevent adding inclusive time for recursive or indirectly called functions). The #call column indicates the number of invocations of the function.
See Relative profiles of functions on one node from MC++ program.
displays its function profile sorted in decreasing order of the exclusive time.
These types of displays makes it possible to quickly identify code bottlenecks or improper computational load balance.
Statistics
The profiles above are generated using the default profiling library. They represent values summed over all invocations of the functions. Often, however, more analysis is needed. To identify the functions having exclusive times that vary significantly for each invocation, for example, we enable the profile statistics option of the library, and then recompile and rerun the application. This generates profile files with additional data, in this case, the standard deviation of the exclusive time spent in each function across different invocations.
Profile Timers
So far, this analysis has been useful in identifying templates with interesting profiles, but often we need to focus our attention with more detailed, user-defined profile timers. The user specifies timers by defining the points to start and stop the timers. These act like function timers, displaying exclusive or inclusive times.
TAU_PROFILE_START(looptimer);
for (i=0; i < n; i++) { g(i); }
for (j=0; j < m; j++) { h(j); }
TAU_PROFILE_STOP(looptimer);
When multiple timers are used within the same function, the timers should either be independent of each other or nested. If the timers overlap, the exclusive time for the outer timer is invalid. To avoid this problem, the profiling library detects timer overlap at runtime. A warning will be issued at the earliest point that such an overlap is detected.
Hardware Performance Counters
Profiling helps us identify functions that require considerable execution time, but more detailed information may be necessary to understand that behavior. We might, for example, need to track secondary data cache miss behavior. To do this, TAU provides access to hardware performance counters in the CPU. On an SGI/Cray Origin 2000, we accessed the performance counters on the R10000 CPU via the Perfex API
See M. Zagha, B. Larson, S. Turner, and M. Itzkowitz, "Performance Analysis Using the MIPS R10000 Performance Counters," Proc. Supercomputing `96, IEEE Computer Society, November 1996.
. The TAU profiling library was configured to use hardware counters, rather than the clock, and the results displayed as before with pprof and Racy tools. With this, we were able to evaluate the number of secondary data cache misses for each function, in order to assess data locality and cache behavior of the application. Unfortunately, the cost of accessing the CPU performance counters is significant: on the order of a few hundred microseconds for each read access, as opposed to less then a microsecond for accessing the clock.
Selective Profiling
The overhead increases significantly if every function entry and exit is profiled. If we are interested in the profile data for functions and timers belonging to a single profile group, we can limit profiling to this group of functions with the command line parameter --profile.
User Experiences
MC++
MC++
See S.R. Lee, J.C. Cummings, S.D. Nolen, N.D. Keen, "MC++ and a Transport Physics Framework." Proc. ISCOPE 97, LNCS Vol. 1343, Springer, Dec. 1997.
is a parallel Monte Carlo neutron transport code written in C++ using the POOMA Framework. The MC++ code inputs information describing a set of materials, some of which may be fissile (capable of generating neutrons), and the interfaces between materials. MC++ also reads in collision cross-section data for neutrons interacting with each of the materials in the problem. It then distributes a set of sample neutrons throughout these materials and tracks their behavior over some characteristic period of time, tabulating how many scattering, fission, and absorption events take place. From these statistics, the code can estimate the criticality of the system, that is, whether the fission events are frequent enough to lead to a chain reaction and a nuclear explosion.
The MC++ code contains a few POOMA Fields of physics data, but it relies most heavily on the POOMA Particle classes to store and update neutron data in parallel across processors. The initial performance tuning of MC++ focused on these Particle classes and, in particular, the "update" member function. The update function processes any deferred requests to destroy particles, and then redistributes the particle data so that it resides on the same processor as nearby POOMA Field data. The first profiling goal, then, was to determine the computational cost of the update function relative to other parts of the code.
Because TAU profiling macros have been built into the POOMA Framework, TAU profiling was readily available for use. Profiling macros were added to each of the main functions of the MC++ code, allowing the user to label code sections with unique, descriptive names, and then to gather performance statistics for them. The results are shown in
See pprof output for MC++ code.
,
See Racy output for MC++ code.
,
See Textual profiles of functions on one node from MC++ program, sorted in decreasing order of exclusive time.
, and
See Relative profiles of functions on one node from MC++ program.
. The bar chart in
See Racy output for MC++ code.
shows the particle update function to be the biggest time consumer as expected. Because this information was so accessible with the TAU profiling tools, the programmers could repeatedly assess the impact of various modifications to their implementation. For instance, when they changed the interface of the update function to allow the user to supply an optional array of particle data, indicating whether or not each particle should be considered as a candidate for being sent to another processor, the TAU profiling data gave them critical feedback on how useful this extension was.
When MC++ was scaled to run on a large number of processors, the TAU profiling displays revealed a bottleneck in the section of code which input neutron cross-section data. Using the ability to assign each profiled function to a particular "group", it was easy to focus on this bottleneck. by requesting TAU profiling data from only those functions in the "User I/O" profiling group. When an alternate implementation for this section of code was developed, TAU's profiling data verified that it had the desired scaling with processor numbers.
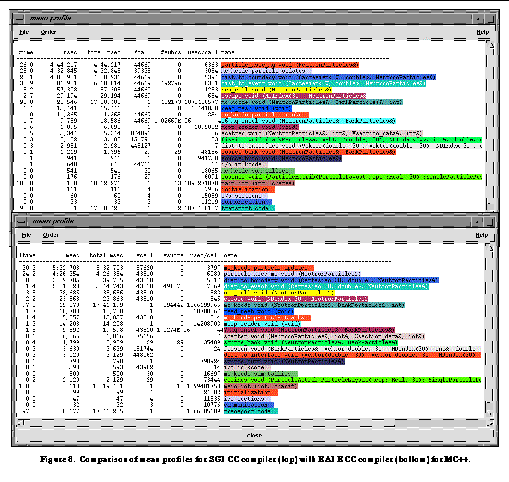
Finally, during the development of MC++, it became necessary to compare the performance of the same code on the same machine, but with different compilers.
See Comparison of mean profiles for SGI CC compiler (top) with KAI KCC compiler (bottom) for MC++.
shows an easy to read side-by-side comparison of the SGI compiler with the KCC compiler. It required no change to the code or instrumentation to produce the second picture, just a simple recompilation.
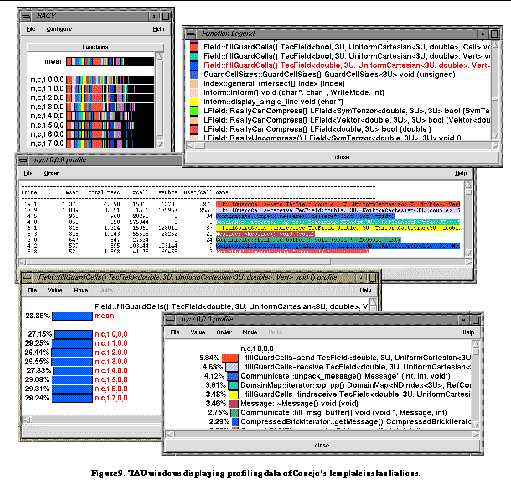
Conejo
Conejo is a multimaterial hydrodynamics code under development at Los Alamos National Lab that is built on top of the POOMA framework. It calculates high mach number flows involving non-mixing materials using real equations of state and strength properties of solids. It is written in a mix of data-parallel (using POOMA parallel fields) and SPMD modes, and runs in serial and in parallel. It was successfully tuned with the aid of TAU's profiling.
Conejo itself is not instrumented for profiling and thus profiling relied on the instrumentation within POOMA. The POOMA use in Conejo relied on many advanced C++ template techniques (expression templates, template metaprogramming), which necessitated extensive inlining and aggressive optimization in the compiler. Even a small amount of profiling code would strongly perturb the performance of these critical routines. Thus, our ability to selectively enable profiling was necessary.
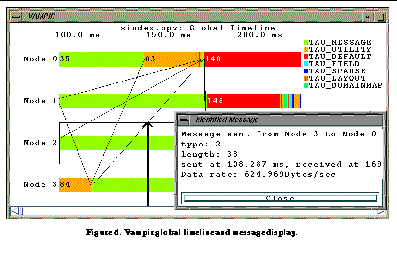
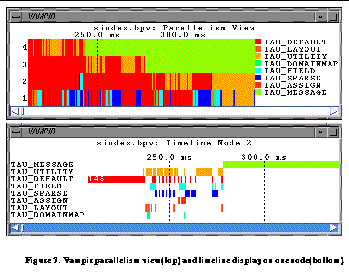
In addition, the tuning of Conejo required TAU's ability to provide both aggregate and trace information. The materials in the simulation required different computations and the materials moved around in the computational domain in complex ways, making it necessary to use adaptive load balancing schemes. Aggregate timings were useful for determining that the computation as a whole was out of balance, and the trace information was useful for determining that individual subcomponents of the algorithm were out of balance. Some profiling data for Conejo's template instantiations is shown in
See TAU windows displaying profiling data of Conejo's template instantiations.
Profiling Expression Templates in Blitz++
Another advantage of the TAU profiler is its ability to profile expression templates and to present the related performance information in a high-level form. Expression templates
See T. Veldhuizen, "Expression Templates," C++ Report, 7(5):26-31, June 1995.
allow logical and algebraic expressions to be passed to functions as arguments that are inlined in the function body. Traditionally, operator overloading in C++ permits a natural notation for building expressions with arrays using pairwise arithmetic overloaded operators. Evaluating these expressions, however, requires the creation of temporaries, which results in performance degradation. Expression templates are used instead to build a representation of the parse tree for the right hand side of an expression that avoids the high cost of binary arithmetic operators. The expression is parsed at compile time, and stored as a nested template argument of an expression type. This technique can be used to evaluate vector and matrix expressions in a single pass without temporaries.
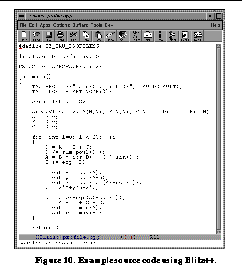
See Example source code using Blitz++.
shows a program written with Blitz++
See T. Veldhuizen and M.E. Jernigan, "Will C++ be Faster than Fortran", Proc. ISCOPE 97, LNCS Vol. 1343, Springer, Dec. 1997.
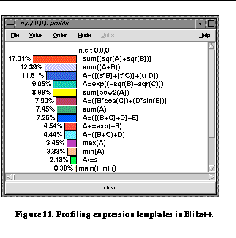
, a C++ class library that uses expression templates. Existing tools are useless when profiling such a program because they would chart the time spent in internal routines pertaining to the parse tree (i.e., the functions resulting from the full expression template expansion). Further, their representation of the type for the expression template for A+B*C, say, would be something hard to interpret like "Expression<OpAdd,Array,Expression<OpMultiply,Array,Array>>." TAU gives the user the flexibility to choose the level at which profiling takes place. Furthermore, the profiling information can be represented in a form specific to the meaning of the nested types. With the knowledge of what the nested type means, the string given to TAU can be of the form "Array+Array*Array," resulting in a more readable report. In
See Profiling expression templates in Blitz++.
, TAU shows a high-level profile representation of the performance of the expression template code from
See Example source code using Blitz++.
.
Related Work
The work presented here follows a long history of performance analysis research. Clearly, there is much that we have borrowed from and share with other tools. For instance, the profiling data generated is fairly standard, modeled after the classic Unix prof and gprof facilities, but extended here across nodes, contexts, and threads of the HPC++ parallel execution model. Similarly, the recording of event traces is commonly found in tools for parallel performance analysis, notably Pablo
See V.S. Adve, J.M. Crummey, M. Anderson, K. Kennedy, J. C. Wang, and D. A. Reed, "Integrating Compilation and Performance Analysis for Data-Parallel Programs," Proc. of the Workshop on Debugging and Performance Tuning for Parallel Computing Systems, Jan. 1996.
and AIMS
See J. Yan, "Performance Tuning with AIMS---An Automated Instrumentation and Monitoring System for Multicomputers," Proc. 27th Hawaii Int. Conf. on System Sciences, Hawaii, Jan. 1994.
. The primary contributions of this work come from solving problems associated with the C++ language and its use in parallel scientific applications and frameworks. In this respect, we comment on related efforts for language-directed instrumentation and performance analysis, and discuss other profiling tools available for use with C++.
There has always been a concern for the language environment in which performance measurement is being performed. At low levels, the issues mostly involves how instrumentation is implemented, what effects that the instrumentation has on program execution, and how sequential and parallel execution state is observed. For imperative sequential languages, represented by Fortran and C, the performance model is basically characterized by where execution time is spent in relation to the program source. When these languages are used for parallel execution, either with a parallelizing compiler or with a parallel library, the parallel performance model becomes more complicated, but not because of the language abstractions. In the parallelizing compiler case, the problem is one of associating performance measurement with source location in the presence of code optimization. For example, Cray's MPP Apprentice
See D. Pase, "MPP Apprentice: A Non-Event Trace Performance Tool for the Cray T3D," Workshop on Debugging and Performance Tuning for Parallel Computing Systems, Oct. 1994.
supports source-level performance analysis for highly-optimized, parallel programs written C, Fortran, and Fortran90. In the case of parallel libraries, the performance model must be extended to reflect the parallel programming model used, message passing or shared memory. For example, a profiling wrapper can be developed for an implementation of MPI standard to capture message passing performance information for analysis, and this can be used unchanged across languages.
When the language embodies higher-level semantics the performance measurement and analysis issues above are more difficult to address because they depend on how the semantics are implemented. Parallel languages, such as HPF, create a semantic gap between the developer's mental model of a program and its realized execution on a parallel machine. Overcoming the obstacles to understanding program performance requires close integration between the performance measurement and analysis tools and the language compiler, as is demonstrated in the Pablo / Fortran D effort
See V.S. Adve, J.M. Crummey, M. Anderson, K. Kennedy, J. C. Wang, and D. A. Reed, "Integrating Compilation and Performance Analysis for Data-Parallel Programs," Proc. of the Workshop on Debugging and Performance Tuning for Parallel Computing Systems, Jan. 1996.
. We regard many of the difficulties encountered for C++ performance measurement as overcoming the semantic problems of relating program execution information to program source representation and user-level framework abstractions. This view also supported by research on object-oriented program analysis which indicates that conventional approaches are insufficient for dealing with OO semantics
See D. Lange and Y. Nakamura, "Object-Oriented Program Tracing and Visualization," IEEE Computer, Vol. 30, No. 5, pp. 63-70, May 1997
.
In comparison, then, with other tools that are available for use with C++, TAU's approach provides a more complete relationship of the C++ program to the measured performance information. For instance, Intel's Vtune product can generate a wealth of low level performance information of a C++ execution, but it depends highly on PC-based compilers for symbol table information to correlate the data back to generated code. SGI's Speedshop uses binary instrumentation and statistical sampling approaches to also get extensive performance data, but it has limitations in relating this information with the view that expression templates provide to the user. In both cases, the lack of source-level instrumentation prevents these tools from allowing the framework designers to supply semantic-information to the performance measurement system that can be utilized in analyses to give more meaningful views of the performance data.
Conclusions and Future Work
Our experiences with the TAU portable profiling package for C++ have thus far been very positive. The package runs on SGI Power Challenge and Origin 2000 platforms (including ASCI Blue Mountain), the Intel Teraflop machine (ASCI Red), Cray T3E, Sun and HP workstations, and PC clusters running Linux. We are working currently to install it on the IBM SP platform. In addition to the variety of machines supported, TAU has been used throughout the software layers in the ACTS toolkit. The libraries and frameworks at LANL currently instrumented include POOMA (Parallel Object Oriented Methods and Applications), ACLMPL (Advanced Computing Laboratory Message Passing Library), A++/P++ (Array Class Library), PAWS (Parallel Application Work Space), ACLVIS (Advanced Computing Laboratory Visualization Library), MC++ (Monte Carlo simulation package).
Although simplified by the TAU profiling API, inserting instrumentation is a manual process at present. We are pursuing two avenues in this regard. We are working with Edison Design Group (EDG) and Kuck and Associates (KAI) to implement compile-time instrumentation capabilities. A by-product of this effort will be program information that will enable TAU's static analysis tools
See B. Mohr, A. Malony, and J. Cuny, "TAU," in G.V. Wilson and P. Lu (Eds.), Parallel Programming using C++, MIT Press, 1996.
to select, via structured program views (e.g., a class browser), what code will be instrumented. The instrumentation can then be generated automatically. The static tools are also linked with profile or trace displays where functions can be selected and the corresponding program code shown. These capabilities will be a significant aid to users in maintaining a meaningful correspondence between the program and its performance. We also intend to explore the use of dynamic instrumentation
See J.K. Hollingsworth, B.P. Miller, M. J. R. Gonçalves, O. Naim, Z. Xu and L. Zheng, "MDL: A Language and Compiler for Dynamic Program Instrumentation," Proc. 1997 International Conference on Parallel Architectures and Compilation Techniques, pp. 201-12, Nov. 1997.
to select and enable instrumentation at runtime. It is unlikely that all of the nuances of C++ instrumentation can be handled dynamically, but extending the API and its implementation to allow external instrumentation interaction could provide important runtime adaptive control.
In general, better support is needed for understanding the performance information TAU profiling can produce. The object-oriented profiling approach we take for C++ can generate performance statistics for a large number of performance "entities," at maximum representing the cross product of classes, types, object instances, threads, nodes, and other attributes. This makes presenting the performance data in understandable ways a challenge. Source code linking is one way to aid the user in determining what the entities mean, especially when long names are necessary for unique identification. But we need better techniques to create performance analyses that abstract data complexity into meaningful performance views. Indeed, our current displays can stress readability unless care is taken to minimize the detail shown. The use of three dimensional graphics and virtual reality will be investigated.
Most of our present focus has dealt with the language aspects that make C++ profiling difficult. To a lesser extent, we have addressed problems resulting from the parallel HPC++ programming and execution model, mostly concerning ourselves with how the profile information is maintained on the thread, context, and node basis. However, there are aspects of profiling parallel execution in the HPC++ model - synchronization, collective parallel operations, remote memory references, and remote member function invocation - that we intend to improve. Building on the present instrumentation in the Tulip runtime system and HPC++Lib, we will provide profiling support to capture program-wide performance information showing system oriented views.
Acknowledgments.
We gratefully acknowledge Todd Veldhuizen's work on profiling expression templates and Julian Cummings work on the MC++ application. Ariya Lohavanichbutr produced the graphical displays used in some of the figures and Bernd Mohr has made numerous contributions to TAU.
References
-
Advanced Computing Laboratory (LANL), "Scientific Template Library - Part of the DOE 2000 ACTS Toolkit," 1998. URL:http://www.acl.lanl.gov/SciTL/.
-
Advanced Computing Laboratory(LANL), "TAU Portable Profiling," 1998. URL:http://www.acl.lanl.gov/tau.
-
V.S. Adve, J.M. Crummey, M. Anderson, K. Kennedy, J. C. Wang, and D. A. Reed, "Integrating Compilation and Performance Analysis for Data-Parallel Programs," Proc. of the Workshop on Debugging and Performance Tuning for Parallel Computing Systems, Jan. 1996.
-
F. Bassetti, K. Davis, and D. Quinlan, "A Comparison of Performance-Enhancing Strategies for Parallel Numerical Object-Oriented Frameworks," Proc. ISCOPE 97, LNCS Vol. 1343, Springer, Dec. 1997.
-
J. Dongarra and L.S. Blackford, "ScaLAPACK tutorial," Proc. of Applied Parallel Computing, Industrial Computation and Optimization, Third International Workshop, PARA `96, Aug. 1996.
-
I. Foster and C. Kesselman, "Globus: A Metacomputing Infrastructure Toolkit," Proc. of the Workshop on Environments and Tools for Parallel Scientific Computing, Aug. 1996.
-
S.L. Graham, P.B. Kessler, and M.K. McKusik, "An Execution Profiling for Modular Programs," Software -- Practice and Experience, Vol. 13, pp. 671-85, 1983.
-
J.K. Hollingsworth, B.P. Miller, M. J. R. Gonçalves, O. Naim, Z. Xu and L. Zheng, "MDL: A Language and Compiler for Dynamic Program Instrumentation," Proc. 1997 International Conference on Parallel Architectures and Compilation Techniques, pp. 201-12, Nov. 1997.
-
Y. Ishikawa, R.R. Oldehoeft, J.V.W. Reynders, and M. Tholburn (Eds.), Scientific Computing in Object-Oriented Parallel Environments, Proc. ISCOPE97, LNCS Vol. 1343, Springer, Dec. 1997.
-
E. Johnson, D. Gannon, and P. Beckman, "HPC++: Experiments with the Parallel Standard Template Library," Proc. International Conference on Supercomputing, July 1997.
-
D. Lange and Y. Nakamura, "Object-Oriented Program Tracing and Visualization," IEEE Computer, Vol. 30, No. 5, pp. 63-70, May 1997
-
S.R. Lee, J.C. Cummings, S.D. Nolen, N.D. Keen, "MC++ and a Transport Physics Framework." Proc. ISCOPE 97, LNCS Vol. 1343, Springer, Dec. 1997.
-
B. Miller, M. Callaghan, J. Cargille, J. Hollingsworth, R. Irvin, K. Karavanic, K. Kunchithapadam, and T. Newhall, "The Paradyne Parallel Performance Measurement Tools," IEEE Computer, Vol. 28, No. 11, pp.37-46, November 1995.
-
B. Mohr, A. Malony, and J. Cuny, "TAU," in G.V. Wilson and P. Lu (Eds.), Parallel Programming using C++,
MIT Press, 1996.
-
Pallas GmbH, "VAMPIR - Visualization and Analysis of MPI Resources," 1998. URL:http://www.pallas.de/pages/vampir.html.
-
D. Pase, "MPP Apprentice: A Non-Event Trace Performance Tool for the Cray T3D," Workshop on Debugging and Performance Tuning for Parallel Computing Systems, Oct. 1994.
-
J.V.W. Reynders et. al., "Pooma: A Framework for Scientific Simulation on Parallel Architectures," in G.V. Wilson and P. Lu (Eds.), Parallel Programming using C++, pp. 553-594, MIT Press, 1996.
-
B. Stroustrup, The C++ Programming Language, Third Edition, Addison-Wesley, Massachusetts, June 1997.
-
Silicon Graphics, Inc., "Speed Shop User's Guide," 1997. URL:http://techpubs.sgi.com.
-
T. Veldhuizen, "Expression Templates," C++ Report, 7(5):26-31, June 1995.
-
T. Veldhuizen and M.E. Jernigan, "Will C++ be Faster than Fortran", Proc. ISCOPE 97, LNCS Vol. 1343, Springer, Dec. 1997.
-
J. Yan, "Performance Tuning with AIMS---An Automated Instrumentation and Monitoring System for Multicomputers," Proc. 27th Hawaii Int. Conf. on System Sciences, Hawaii, Jan. 1994.
-
M. Zagha, B. Larson, S. Turner, and M. Itzkowitz, "Performance Analysis Using the MIPS R10000 Performance Counters," Proc. Supercomputing `96, IEEE Computer Society, November 1996.