A. Create an event trace.
% setenv TAU_MAKEFILE
% /opt/apps/tau/tau-2.17.1/x86_64/lib/Makefile.tau-mpi-pdt-pgi
% set path=(/opt/apps/tau/tau-2.17.1/x86_64/bin $path)
% make F90=tau_f90.sh
(Or edit Makefile and change F90=tau_f90.sh)
% setenv TAU_TRACE 1
% qsub run.job
% tau_treemerge.pl
(merges binary traces to create tau.trc and tau.edf files)
JUMPSHOT:
% tau2slog2 tau.trc tau.edf –o app.slog2
% jumpshot app.slog2
OR
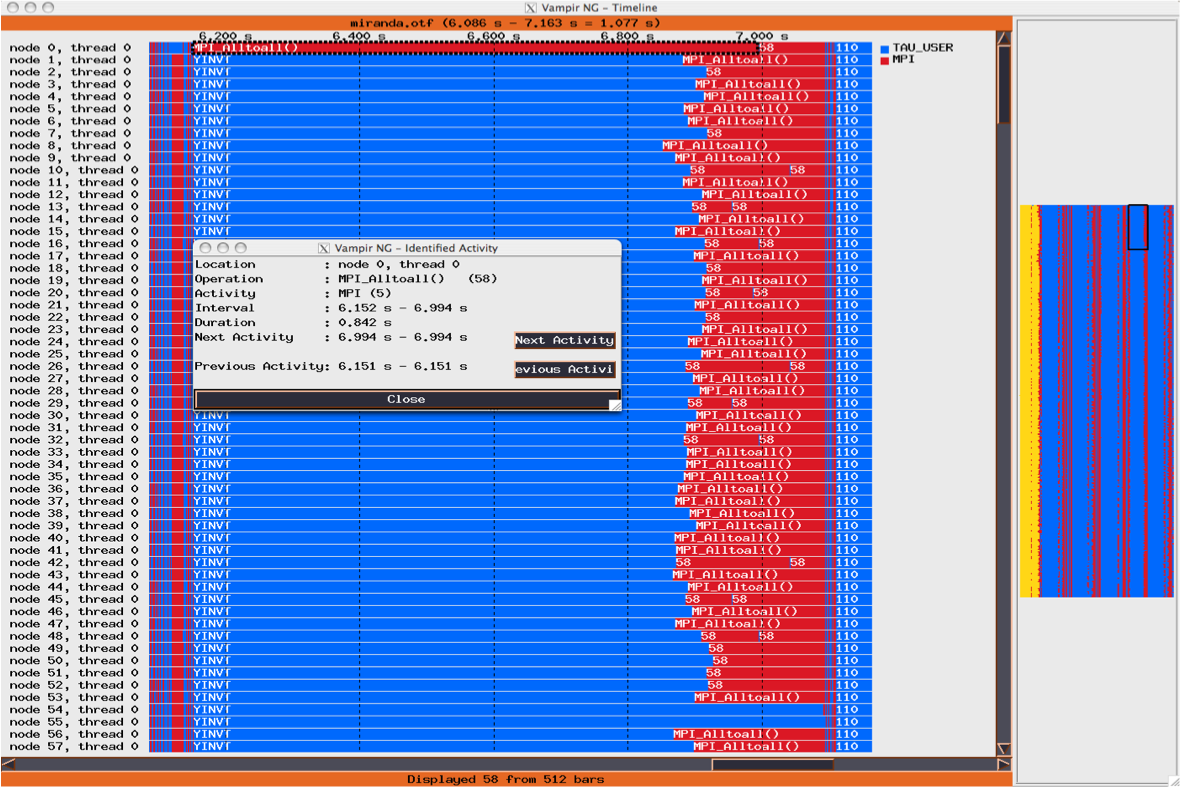
VAMPIR:
% tau2otf tau.trc tau.edf app.otf –n 4 –z
(4 streams, compressed output trace)
% vampir app.otf
(or vng client with vngd server).