A. Examine profiles in PerfExplorer.
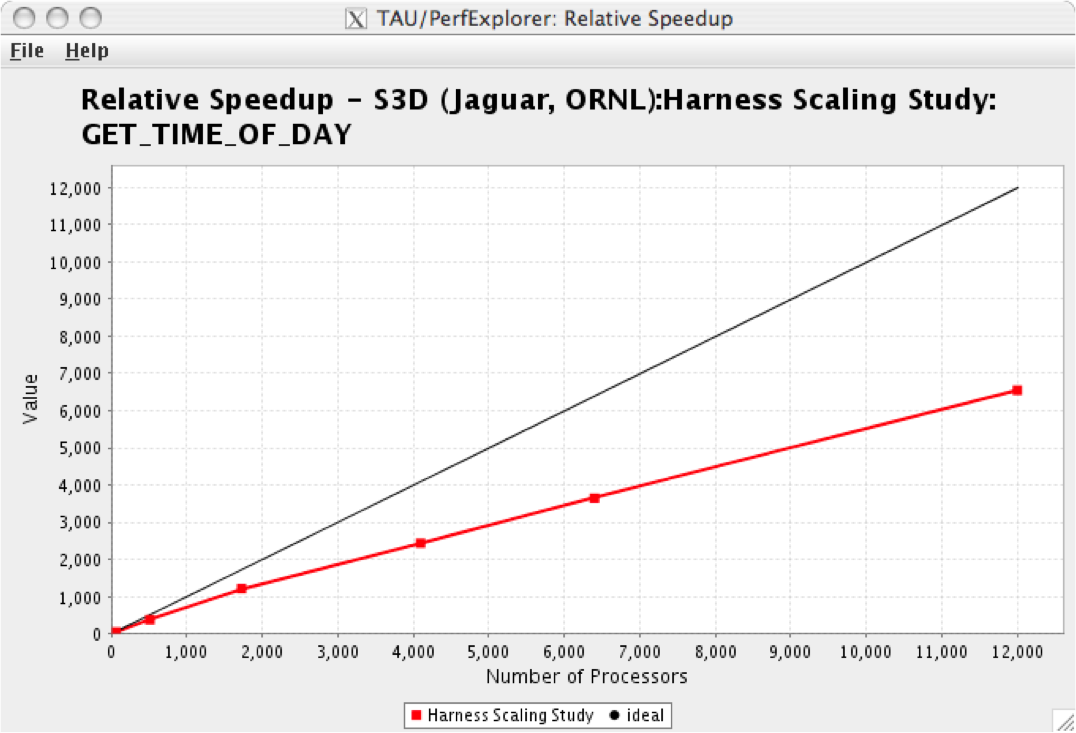
% setenv TAU_MAKEFILE /opt/apps/tau/tau-2.17.1/x86_64/lib/Makefile.tau-mpi-pdt
% set path=(/opt/apps/tau/tau-2.17.1/x86_64/bin $path)
% make F90=tau_f90.sh
(Or edit Makefile and change F90=tau_f90.sh)
% qsub  run1p.job
% paraprof -–pack 1p.ppk
% qsub run2p.job
% paraprof -–pack 2p.ppk ...and so on.
On your client:
% perfdmf_configure
(Choose derby, blank user/password, yes to save password, defaults)
% perfexplorer_configure
(Yes to load schema, defaults)
% paraprof
(load each trial: Right click on trial ->Upload trial to DB
% perfexplorer
(Charts -> Speedup)