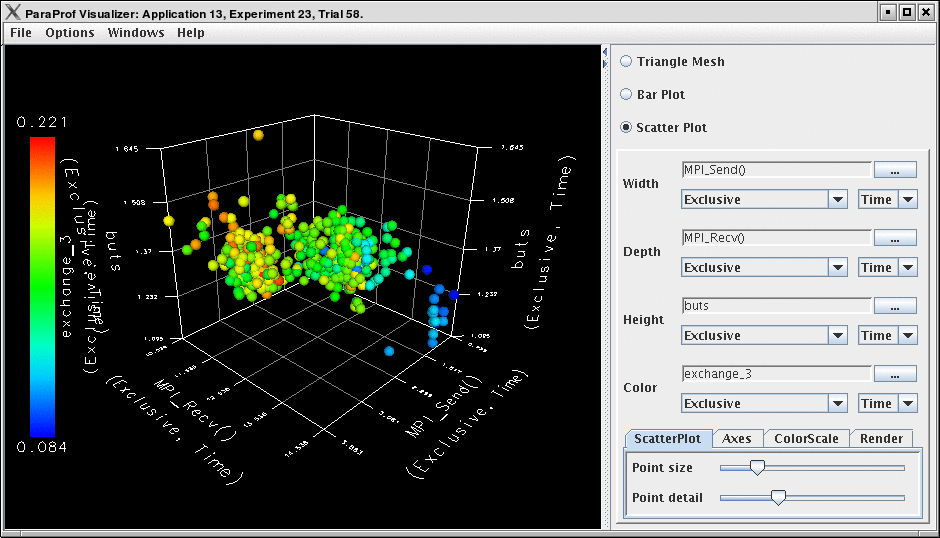
This visualization method plots the value of each thread along up to 4 axes (each a different function/metric). This view allows you to discern clustering of values and relationships between functions across threads.
Select functions using the button for each dimension, then select a metric. A single function across 4 metrics could be used, for example.
