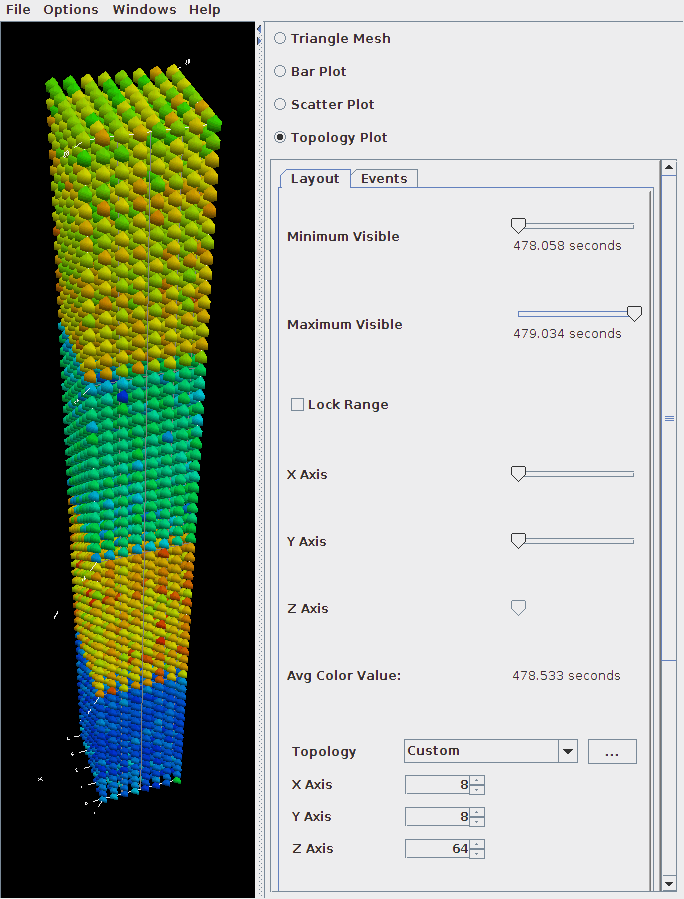
If the loaded profile is a cube file or a profile from a BGB, then this visualization option is available. This visualizations groups the threads in two or three dimensional space using topology information supplied by the profile.
The right side bar provides options to manipulate the visualization. You can select different metrics or topologies. The sliders toward the top allow you to select the range of points to show.
