TAU and SAGE

Introduction
TAU currently uses hand-instrumentation for SAGE. We plan to use PDT for source-to-source translation based instrumentation of SAGE F90 source code. TAU's MPI wrapper library level instrumentation is used to gather information pertaining to the MPI library.Vampir
TAU can generate profiles and event-traces. Event-traces can be visualized using Vampir (Pallas GmbH), a commercial trace visualization tool.

The timeline display highlights different events that take place in processes along a global timeline.
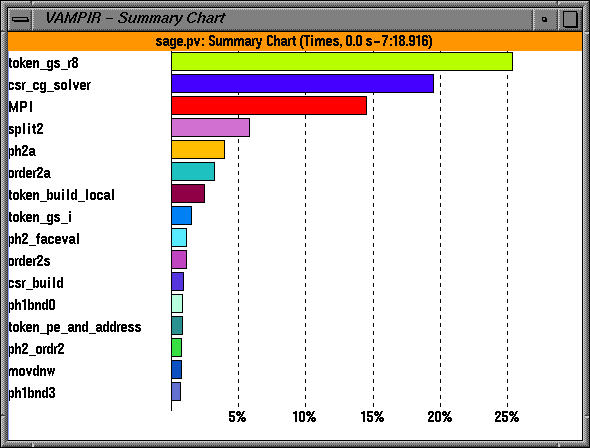
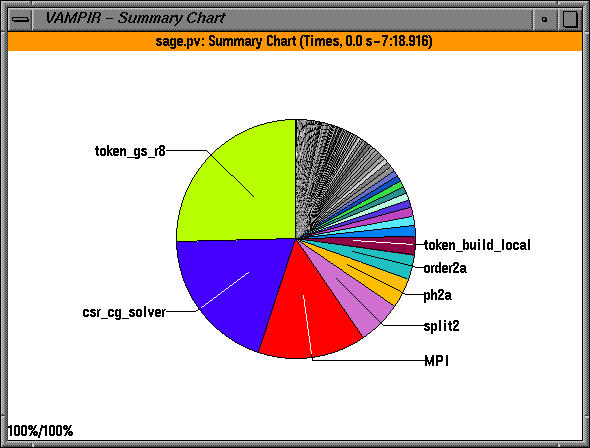
The global summary chart shows the breakdown of time for all processes.
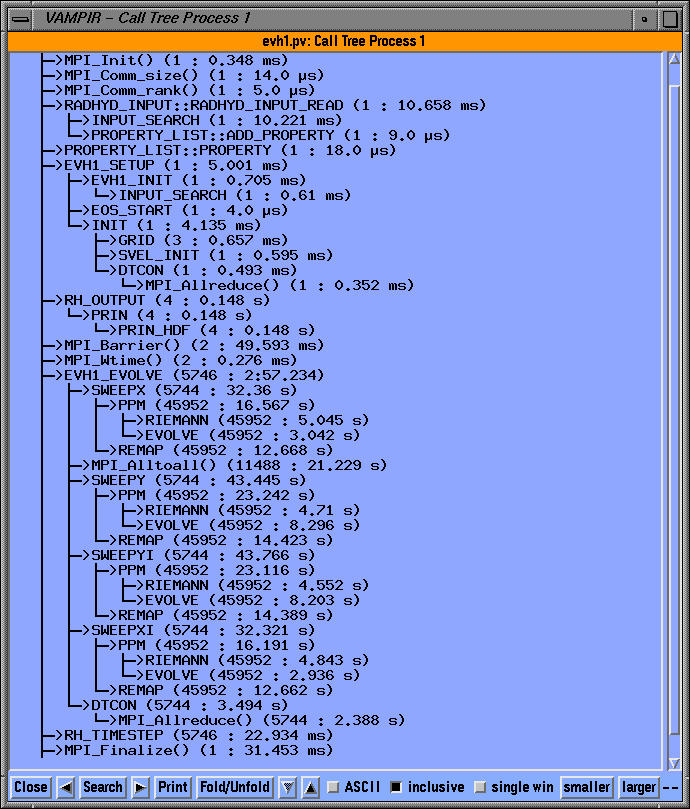
The dynamic calltree on node 0 shows the exclusive time spent in each routine along with the number of times the routine was invoked.
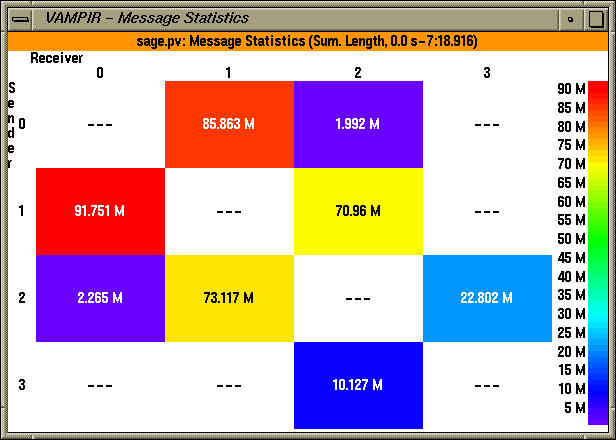
The communication matrix shows the volume of inter-process message communication in the form of a matrix comprised of senders and receivers.
Profiles for multi-processor run using MPI
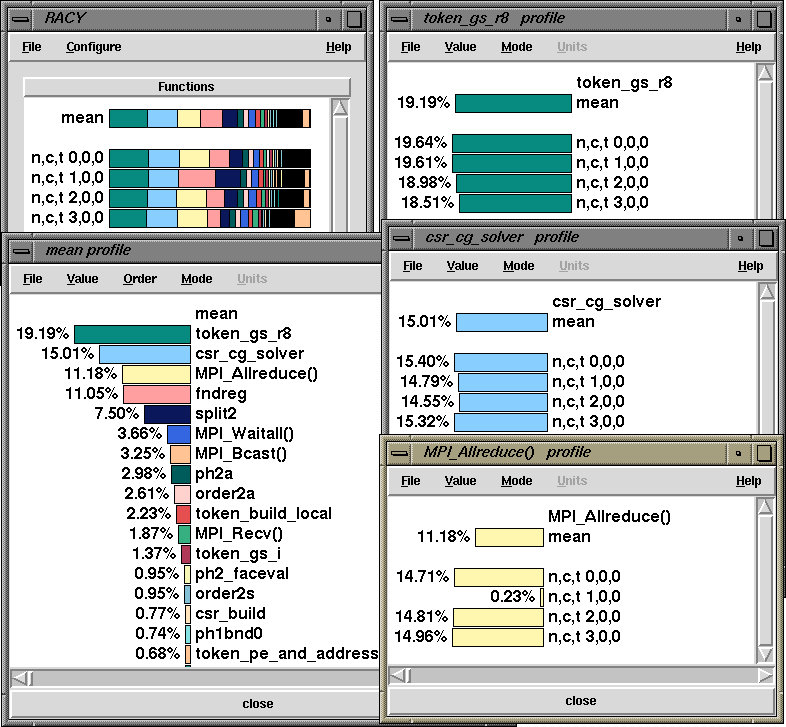
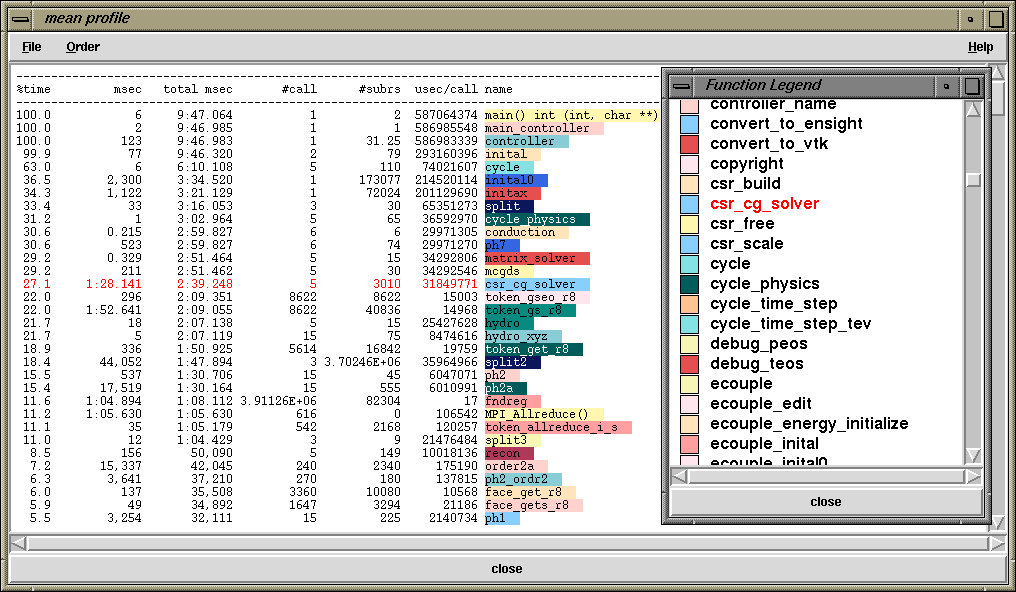
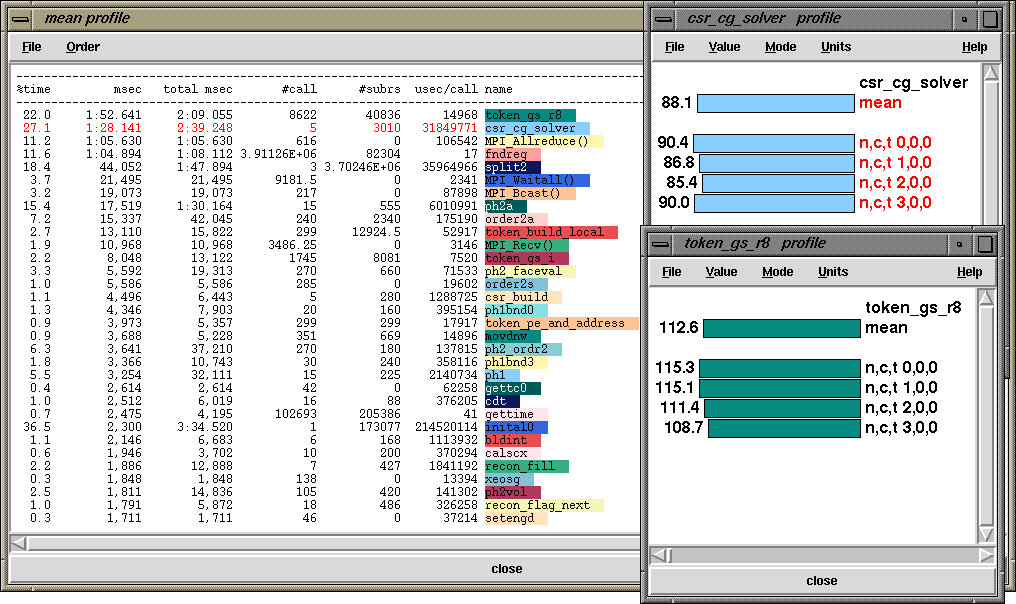
Profiles for a single processor run
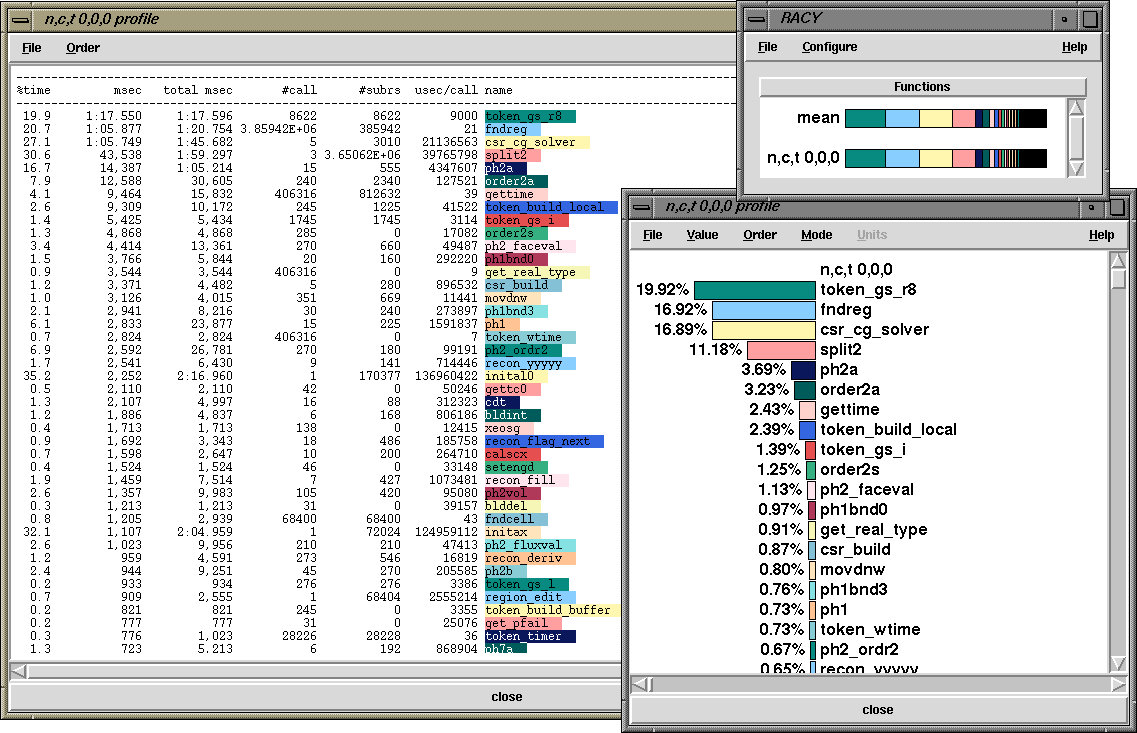 A one processor run shows the breakdown of time in SAGE.