Table of Contents
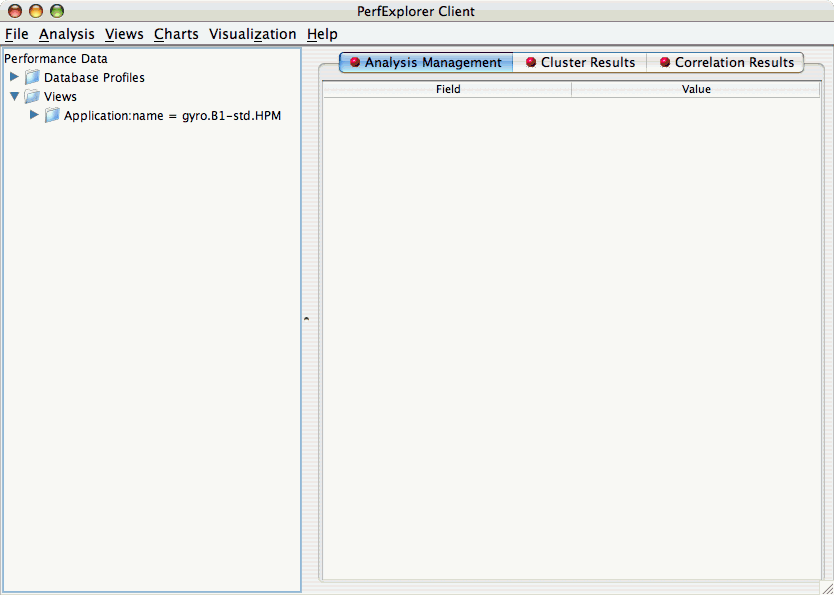
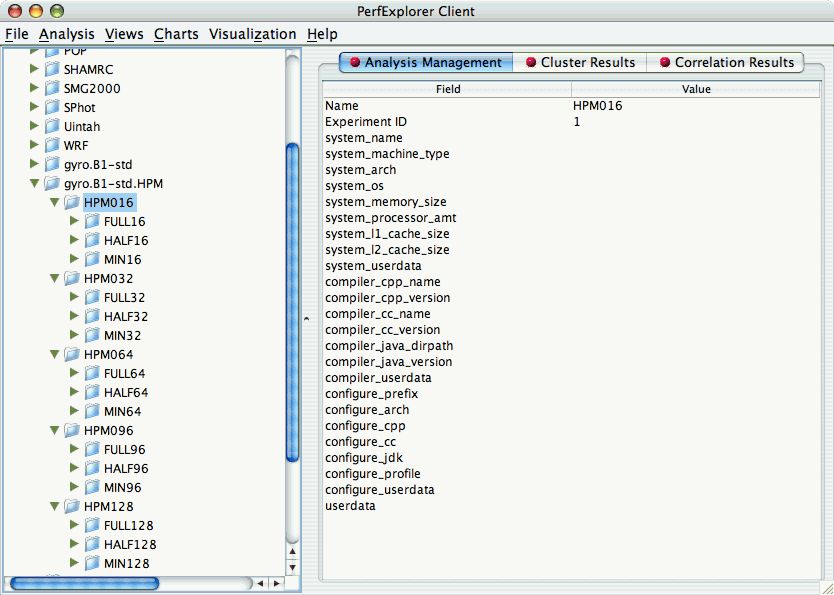
Often times, data is loaded into the database with multiple parametric cross-sections. For example, the charts available in PerfExplorer are primarily designed for scalability analysis, however data might be loaded as a parametric study. For example, in the following example, the data has been loaded with three problem sizes, MIN, HALF and FULL.
In order to examine this data in a scalability study, it is necessary to reorganize the data. However, it is not necessary to re-load the data. Using views in PerfExplorer, you can re-organize the data based on values in the database.
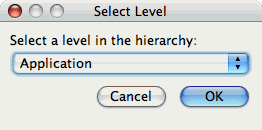
To create a view, select the "Create New View" item under the "Views" main menu item. The first step is to select the table which will form the basis of the view. The three possible values are Application, Experiment and Trial:
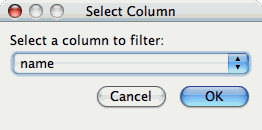
After selecting the table, you need to select the column on which to filter:
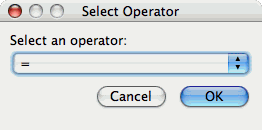
After selecting the column, you need to select the operator for comparing to that column:
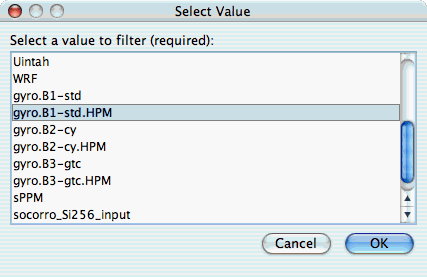
After selecting the operator, you need to select the value for comparing to the column:
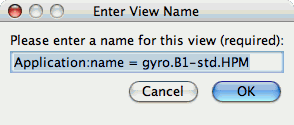
After selecting the value, you need to select a name for the view:
After creating the view, you will need to exit PerfExplorer and re-start it to see the view. This is a known problem with the application, and will be fixed in a future release.