Multi-threaded systems and applications present a more complex environment for performance tools due to the different forms and levels of threading and the greater need for efficient instrumentation. How to determine thread identity, how to store per-thread performance data, and how to provide synchronized and consistent update and access to the data are some of the questions that must be addressed. TAU provides modules that interface with system-specific thread libraries and provide member functions for thread registration, thread identification, and mutual exclusion for locking and unlocking the performance data. This allows the measurement system to work with different thread packages such as pthreads, Windows threads, Java threads, as well as special-purpose thread libraries such as SMARTS [15] and Tulip [2], while maintaining a common measurement model. Because TAU targets a general threading model, it can extend its common thread layer to provide well-defined core functionality for each new thread system.
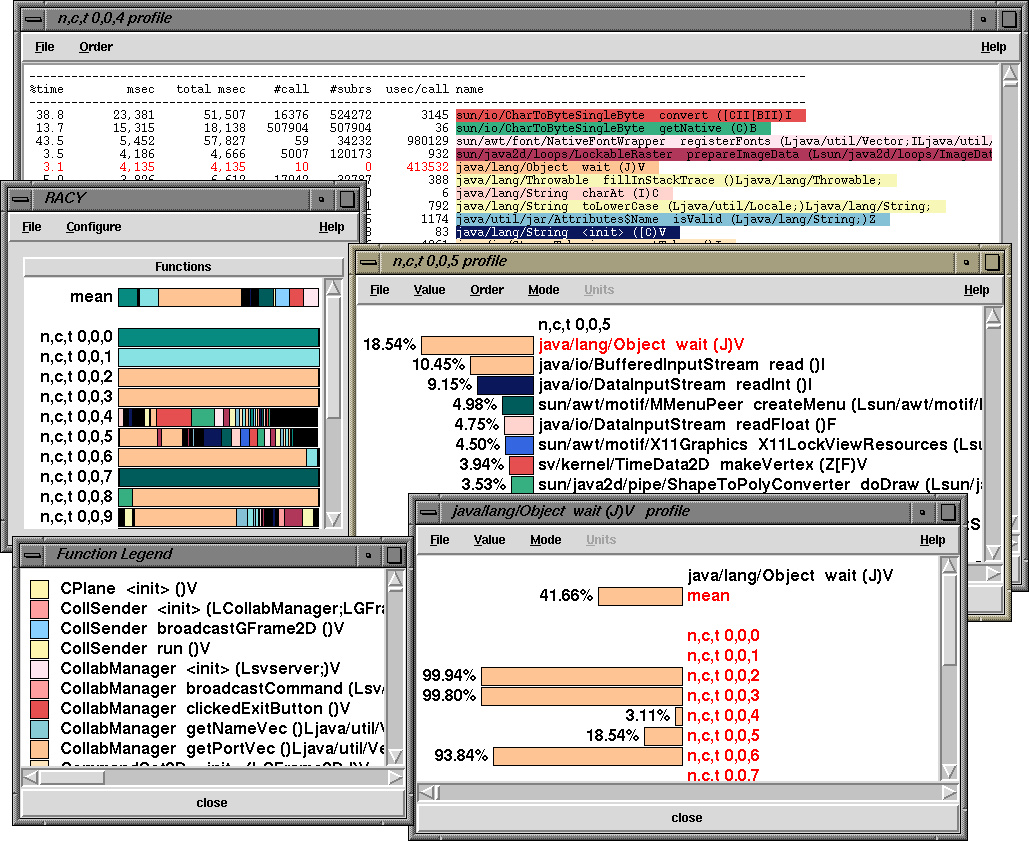
We chose the Java language to demonstrate TAU's application in multi-thread systems since it utilizes both user-level and system-level threads and involves the additional complexity of virtual machine execution. The Java 2 virtual machine provides event callback hooks in the form of the Java Virtual Machine Profiler Interface (JVMPI) [11]. TAU uses JVMPI for performance instrumentation and measurement. The TAU measurement library is compiled into a dynamic shared object which is loaded in the address space of the virtual machine. An initialization routine specifies a mapping of events that are of interest to the performance system and registers a TAU interface that will be called when the events occur. When an event is triggered, event specific information is passed to the TAU interface routine by the virtual machine. TAU identifies the thread in which the event takes place and uses the Java thread interface to maintain per-thread performance data. TAU classifies all method names and their signatures into higher level profile group names. In Figure 1.2 we see the profile of per-thread execution for different methods and groups. Notice that some of the threads (0-3) are performing system functions for the JVM while others (4, 5, and 9) are performing user tasks. Profile (as shown) and tracing performance measurements can be made and reported.
 [bigger image]
Figure: TAU profiles a multi-threaded Java visualization application using JVMPI