


Next: Measurement Overhead and Instrumentation
Up: paper-final
Previous: Introduction
For the past twelve years, the TAU project has conducted research on
performance tools for parallel and distributed systems. The goal of
this work has mainly been the development of robust technology to meet
evolving performance evaluation challenges of state-of-the-art
parallel systems and applications. In particular, we have focused on
problems of performance tool portability, extendability, and
interoperation.
The TAU performance system [9,17] is our integrated toolkit
for performance instrumentation, measurement, analysis, and visualization
of large-scale parallel applications. It targets a general computation
model consisting of shared-memory computing nodes where
contexts reside, each providing a virtual address space shared by multiple
threads of execution. The model is general enough to apply to many
high-performance scalable parallel systems and programming paradigms.
Because TAU enables performance information to be captured at the
node/context/thread levels, this information can be mapped to the
particular parallel software and system execution platform under
consideration.
As shown in Figure 1, the TAU system supports a flexible
instrumentation model that applies at different stages of program
compilation and execution. The instrumentation targets multiple code
points, provides for mapping of low-level execution events to
higher-level performance abstractions, and works with multi-threaded,
message passing, and mixed-mode parallel computation models.
Different instrumentation techniques are supported, including dynamic
instrumentation using the DyninstAPI [4]. All
instrumentation code makes calls to the TAU measurement API to provide
a common measurement model. The TAU measurement library implements
performance profiling and tracing support for performance events
occurring at function, method, basic block, and statement levels.
Performance experiments can be composed from different measurement
modules (e.g., hardware performance monitors, such as PAPI
[3]) and measurements can be collected with respect to
user-defined performance groups. C, C++, Fortran 77/90, OpenMP, and Java
languages are supported. The TAU data analysis and presentation
utilities offer text-based and graphical tools to visualize the
performance data as well as bridges to third-party software, such as
Vampir [11] and Paraver [12] for sophisticated
trace analysis and visualization.
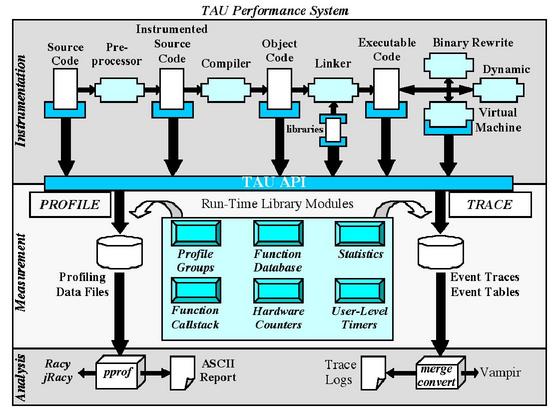
Figure 1: Architecture of the TAU performance system.
TAU has been ported to nearly all high-performance computing platforms
and is being used extensively in the performance analysis of DOE
applications. TAU is also being applied as the primary performance
technology across a diverse set of code development projects,
including Uintah [15], CCA [2], VTF [18], and SAMRAI
[7]. Although the current set of features in the TAU performance
system is quite substantial, it is important to note that users are
always requesting new capabilities. The interesting research problems
that arise concern how to develop new techniques to address these
requests while maintaining tight integration with the rest of the TAU
system. The four problems below are all representative of such
endeavors.
Next: Measurement Overhead and Instrumentation
Up: paper-final
Previous: Introduction
Sameer Suresh Shende
2003-02-21