next up previous
Next: Performance Mapping and Dynamic Up: paper-final Previous: TAU Performance System

Measurement Overhead and Instrumentation Control

The selection of what ``events'' to observe when measuring the performance of a parallel application is an important consideration, as it is the basis for how performance data will be interpreted. The performance events of interest depend mainly on what aspect of the execution the user wants to see, so as to construct a meaningful performance view from the measurements made. Typical events include control flow events that identify points in the program that are executed, or operational events that occur when some operation or action has been performed. Events may be atomic or paired to mark begin and end points, for example, to mark the entry and exit of a routine. Choice of performance events also depends on the scope and resolution of the performance measurement desired. However, the greater the degree of performance instrumentation in a program, the higher the likelihood that the performance measurements will alter the way the program behaves, an outcome termed performance perturbation. Most performance tools, including TAU, address the problem of performance perturbation indirectly using techniques to reduce the performance intrusion (i.e., overhead) associated with performance measurement. This overhead is a result of two factors: 1) the execution time to make the measurement relative to the ``size'' of the event, and 2) the frequency of event occurrence. The first factor concerns the influence of the measurement overhead on the observed performance of a particular event. If the overhead is large relative to the size of the event, the performance measurement is less likely to be accurate unless its overhead is compensated in some way. The overhead is typically measured in execution time, but can also include the impact on other metrics, such as hardware counts. The second factor relates to overheads as seen from the perspective of the entire program. That is, the higher the frequency of events, the larger percentage of the execution will be taken up by performance measurement. Techniques to control performance intrusion are directed towards making performance measurement more efficient or controlling the performance instrumentation. The former is a product of engineering of the measurement system. That is, the lighter-weight the measurment system, the lower the overhead. Here, we are concerned with controlling performance instrumentation to remove or disable performance measurement for ``small'' events or events that occur with high frequency. Clearly this will eliminate the overhead otherwise generated, but how are these events determined before a measurment is made? It may be possible for sophisticated source code analysis to identify small code segments, but this is not a complete solution since the execution time could depend on runtime parameters. Plus, we would like a solution to work across languages and few static analysis tools are available. Instead, a direct measurement approach will likely be needed. The idea is that a series of instrumentation experiments would be conducted to observe the measurement overhead, weeding out those events resulting in unacceptable levels of intrusion. Whereas this performance data analysis and instrumentation control can be done manually, it is tedious and error-prone, especially when the number of performance events is large. Thus, the problem we addressed was how to develop a tool to help automate the process in TAU. The TAU performance system instruments an application code using an optional instrumentation control file that identifies events for inclusion and exclusion. The TAU instrumentor's default behavior is to instrument every routine and method. Obviously, this instrumentation may result in high measurement overhead, and the user can manually modify the file to eliminate small events, or those that are not interesting to observe. As noted above, this is a cumbersome process. Instead, the TAUreduce tool allows the user to write instrumentation rules that will be applied to the parallel measurement data to identify which events to exclude. The output of the tool is a new instrumentation control file with those events de-selected for instrumentation, thereby reducing measurement overhead in the next program run. Table 1 shows examples of the TAUreduce rule language. A simple rule is an arithmetic condition written as:
[EventName: | GroupName:] Field Operator Number
where Field is a TAU profile metric (e.g., numcalls, percent, usec, usec/call), Operator is one of <, >, or =, and Number is any number. A rule applies to all events unless specified explicitly, either by the EventName (e.g., routineA) or by the event GroupName (e.g., TAU_USER). In the latter case, all events that belong to the group are selected by the rule. A compound rule is a logical conjunction of simple rules. Multiple rules, appearing on separate lines, are applied disjunctively.

Table 1: Examples of TAUreduce rule language.
Description Rule
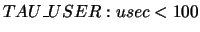
Exclude all events that are members of the TAU_USER group and use less than 100 microseconds $TAU\_USER:usec < 100$
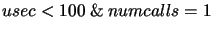
Exclude all events that have less than 100 microseconds and are called only once $usec < 100 \ \& \ numcalls = 1$
Exclude all events that have less than 100 microseconds $usecs/call < 100$
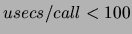
per call or have a total inclusive percentage less than 5 $percent < 5$


As a simple example of applying the instrumentation reduction analysis, consider two algorithms to find the $k$th largest element in a list of $N$ unsorted elements. The first algorithm ( kth_largest_qs) uses quicksort first to sort the list and then selects the $k$th element. The second algorithm ( select_kth_largest) scans the list keeping a sorted set of the $k$ largest elements seen thus far. At the end of the scan, it selects the least of the set. We ran the program on a list of 1,000,000 elements with $k$=2324, first with minimal instrumentation to determine the execution time of the two algorithms: kth_largest_qs (.188511 secs), select_kth_largest (.149594 secs). Total execution time was .36 secs on a 1.2 Ghz Pentium III machine. Then the code was instrumented fully and run again. The profile results are shown in the top half of Figure 2. Clearly, there is significant performance overhead and the execution times are not accurate, even though TAU's per event measurement overhead is very low. We defined the rule
$usec > 1000 \ \& \ numcalls > 400000 \ \& \ usecs/call < 30 \ \& \ percent > 25$
and applied TAUreduce, eliminating the events marked with ``(*)''. Running the code again produced the results in the lower half of Figure 2. As seen, the execution times are closer to what we expect.
Figure 2: Example application of TAUreduce tool.
\begin{figure}
{\scriptsize
\begin{verbatim}
NODE 0;CONTEXT 0;THREAD 0:
--...
...p
0.0 0.02 0.02 49 0 0 int ceil\end{verbatim}
}
\vskip-.1in
\end{figure}
While the above example is rather simple, the TAUreduce tool can be applied to large parallel applications. It is currently being used in Caltech's ASAP ASCI project to control instrumentation in the Virtual (Shock) Test Facility (VTF) [18]. TAUreduce is part of the TAU performance system distribution and, thus, is supported on all platforms where TAU is available. It is currently being upgraded to include analysis support for multiple performance counters. One important comment about this work is that it deals with a fundamentally practical problem in parallel performance observation, that is, the tradeoff of measurement detail and accuracy. By eliminating events from instrumentation, we lose the ability to see those events at all. If the execution of small routines accounts for a large portion of the execution time, that may be hard to discern without measurement. On the other hand, accurate measurement is confounded by high relative overheads. We could attempt to track these overheads at runtime and subtract accummulated overhead when execution time measurements are made. This is something we are pursuing in TAU to increase timing accuracy, but it requires determining a minimum overhead value from measurement experiments on each target platform. Another avenue is to change performance instrumentation on-the-fly as the result of identifying high overhead events. We are also considering this approach in TAU.
next up previous
Next: Performance Mapping and Dynamic Up: paper-final Previous: TAU Performance System
Sameer Suresh Shende 2003-02-21