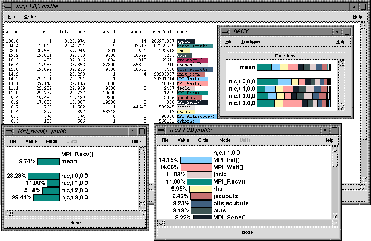
Figure: TAU profile browser displays for NAS Parallel Benchmark LU running on 4 processors
Parallel programming on distributed memory computer systems is commonly of a SPMD style supported by portable message passing libraries. While the SPMD model provides a ``single program'' view towards application-level performance events, inter-node performance interactions are captured by message communication events. Application instrumentation in this case is facilitated by TAU's macro-based soure-level instrumentation and compile-time measurement configuration. However, instrumentation at the source level is not possible without access to the source code. A convenient mechanism to get around this problem with libraries (e.g., a message communication library) is in the use of a wrapper interposition library. Here, the library designer provides alternative entry points for some or all routines, allowing a new library to be interposed that reimplements the standard API with routine entry and exit instrumentation, calling the native routine in between.
Requiring that such profiling hooks be provided in a standardized library before an implementation is considered "compliant" forms the basis of an excellent model for developing portable performance profiling tools for the library. Parallel SPMD programs are commonly implemented using a message passing library for inter-node communication, such as MPI. The MPI Profiling Interface [8] provides a convenient mechanism to profile message communication. This interface allows a tool developer to interface with MPI calls without modifying the application source code, and in a portable manner that does not require a vendor to supply the proprietary source code of the library implementation. A performance tool can provide an interposition library layer that intercepts calls to the native MPI library by defining routines with the same name (e.g., MPI_Send). These routines can then call the name-shifted native library routines provided by the MPI profiling interface (e.g., PMPI_Send). Wrapped around the call is performance instrumentation. The exposure of routine arguments allows the tool developer to also track the size of messages, identify message tags or invoke other native library routines, for example, to track the sender and the size of a received message, within a wild-card receive call.

Figure: TAU profile browser displays for NAS Parallel Benchmark LU running on 4 processors
TAU uses the MPI profiling interface for performance profiling and tracing of message communication events; several other tools also use the interface for tracing (e.g., Upshot [1] and Vampir [12]). Below is the interposition wrapper for the MPI_send routine with TAU entry and exit instrumentation:
  int  MPI_Send( buf, count, datatype, dest, tag, comm )
  void * buf;  int count;  MPI_Datatype datatype;
  int dest;    int tag;    MPI_Comm comm;
  {
    int  retval, typesize;
    TAU_PROFILE_TIMER(tautimer, ``MPI_Send()'',  `` ``,
                      TAU_MESSAGE);
    TAU_PROFILE_START(tautimer);
    if (dest != MPI_PROC_NULL) {
      PMPI_Type_size( datatype, &typesize );
      TAU_TRACE_SENDMSG(tag, dest, typesize*count);
    }
    retval = PMPI_Send(buf, count, datatype, dest, tag, comm);
    TAU_PROFILE_STOP(tautimer);
    return returnVal;
  }
Notice the TAU instrumentation for the start and stop events surrounding the call to PMPI_Send.
Figure 4.1 shows the profile of the NAS Parallel
Benchmark LU suite written in Fortran using TAU's MPI profiling wrapper.
The TAU graphical profile display tool, Racy, shows the execution of
four processes and the timing of MPI events on each process. (Here, a
``process'' maps to a single node with one context and one thread of
execution.) Notice the integration of communication events with routine
performance information. Routine profiles can be shown for each process
(e.g., process 1  n,c,t 1,0,0) and the performance of
individual routines (e.g., MPI_Recv) can be listed for all
processes.
Because the MPI wrapper instrumentation targets TAU's measurement API, it is possible to configure the measurement system to capture various types of performance data, including system and hardware data, as well as switch between profiling and tracing. In addition, TAU's performance grouping capabilities allows MPI event to be presented with respect to high-level categories such as send and receive types. These performance configurations can done without change to the source- and wrapper-level instrumentation.