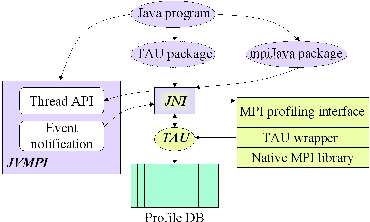
Figure 4.2: TAU instrumentation for Java source, virtual machine, and mpiJava packa\ ges
Multi-threaded systems and applications present a more complex environment for performance tools due to the different forms and levels of threading and the greater need for efficient instrumentation. How to determine thread identity, how to store per-thread performance data, and how to provide synchronized and consistent update and access to the data are some of the questions that must be addressed. TAU provides modules that interface with system-specific thread libraries and member functions for thread registration, thread identification, and mutual exclusion for locking and unlocking runtime performance data structures. This allows the measurement system to work with different thread packages (e.g., pthreads, Windows threads, and Java threads), as well as special-purpose thread libraries (e.g., SMARTS [24] and Tulip [2]) while maintaining a common measurement model. Because TAU targets a general threading model, it can extend its common thread layer to provide well-defined core functionality for each new thread system.
We chose the Java language to demonstrate TAU's application in multi-threaded systems since it utilizes both user-level and system-level threads and involves the additional complexity of virtual machine execution. Performance instrumentation and measurement of multi-threaded interpreted programs such as Java pose several difficulties. Because Java programs are compiled to a platform independent byte-code that is interpreted by a Java Virtual Machine (JVM), a performance system must interface to the JVM to capture performance events, but still make measurements as efficiently as possible. This may be difficult to do portably in the presence of just-in-time (JIT) compilation and runtime adaptive optimizations, as realized by state-of-the-art JVM implementations, such as realized in the Sun Hot-Spot Virtual Machine[25]. Furthermore, it can become difficult to associate virtual machine state with actual system state to record performance measurements accurately.
Conveniently, Java 2 (JDK1.2+) incorporates the Java Virtual Machine Profiler Interface (JVMPI) [19,20] which we have used for our work in TAU [17]. JVMPI provides profiling hooks into the virtual machine and allows a profiler agent to instrument the Java application without any changes to the source code, bytecode, or the executable code of the JVM. JVMPI provides a wide range of events that it can notify to the agent, including method entry and exit, memory allocation, garbage collection, and thread start and stop; see the Java 2 reference for more information. When the profiler agent is loaded in memory, it registers the events of interest and the address of a callback routine to the virtual machine using JVMPI. When an event takes place, the virtual machine thread generating the event calls the profiler agent callback routine with a data structure that contains event specific information. The profiling agent can then use JVMPI to get more detailed information regarding the state of the system and where the event occurred.

Figure 4.2: TAU instrumentation for Java source, virtual machine, and mpiJava packa\
ges
Figure 4.2 describes how JVMPI is used by TAU for performance
measurement.![]() The TAU measurement library is compiled into a dynamic shared
object which is loaded in the address space of the virtual machine. An
initialization routine specifies a mapping of events that are of interest
to the performance system and registers a TAU interface that will be called
when the events occur. It stores the identity of the virtual machine and
requests the JVM to notify it when a thread starts or terminates, a class
is loaded in memory, a method entry or exit takes place, or the JVM shuts
down. When a class is loaded, TAU examines the list of methods in the class
and creates an association of the name of the method and its signature, as
embedded in the TAU object, with the method identifier obtained, using the
TAU Mapping API (see the TAU User's Guide [21]). When an
event is triggered, event specific information is passed to the TAU
interface routine by the virtual machine. When a method entry takes place,
TAU performs measurements and correlates these to the TAU object
corresponding to the method identifier that it receives from JVMPI. TAU
identifies the thread in which the event takes place and uses the Java
thread interface to maintain per-thread performance data. TAU classifies
all method names and their signatures into higher level profile group
names, such as for different Java packages ( /lang, /io,
/awt, etc.).
The TAU measurement library is compiled into a dynamic shared
object which is loaded in the address space of the virtual machine. An
initialization routine specifies a mapping of events that are of interest
to the performance system and registers a TAU interface that will be called
when the events occur. It stores the identity of the virtual machine and
requests the JVM to notify it when a thread starts or terminates, a class
is loaded in memory, a method entry or exit takes place, or the JVM shuts
down. When a class is loaded, TAU examines the list of methods in the class
and creates an association of the name of the method and its signature, as
embedded in the TAU object, with the method identifier obtained, using the
TAU Mapping API (see the TAU User's Guide [21]). When an
event is triggered, event specific information is passed to the TAU
interface routine by the virtual machine. When a method entry takes place,
TAU performs measurements and correlates these to the TAU object
corresponding to the method identifier that it receives from JVMPI. TAU
identifies the thread in which the event takes place and uses the Java
thread interface to maintain per-thread performance data. TAU classifies
all method names and their signatures into higher level profile group
names, such as for different Java packages ( /lang, /io,
/awt, etc.).
To deal with Java's multi-threaded environment, TAU uses a common thread layer for operations such as getting the thread identifier, locking and unlocking the performance database, getting the number of concurrent threads, etc. This thread layer is then used by the multiple instrumentation layers. When a thread is created, TAU registers it with its thread module and assigns an integer identifier to it. It stores this in a thread-local data structure using the JVMPI thread API described above. It invokes routines from this API to implement mutual exclusion to maintain consistency of performance data. It is important for the profiling agent to use the same thread interface as the virtual machine that executes the multi-threaded Java applications. This allows TAU to lock and unlock performance data in the same way as application level Java threads do with shared global application data. TAU maintains a per-thread performance data structure that is updated when a method entry or exit takes place. Since this is maintained on a per thread basis, it does not require mutual exclusion with other threads and is a low-overhead scalable data structure. When a thread exits, TAU stores the performance data associated with the thread to stable storage. When it receives a JVM shutdown event, it flushes the performance data for all running threads to the disk.
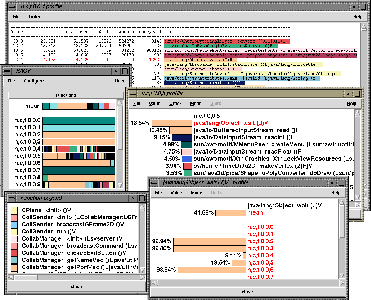
To demonstrate the efficacy of TAU's use of JVMPI for Java, we downloaded a collaborative client-server scientific visualization system, Scivis [5], written entirely in Java. With no modification to the Java source code, we ran the Scivis server with TAU performance measurements enabled, generating the per-thread execution profile shown in Figure 4.3 for different methods across different Java packages. A total of twenty-four threads executed in this run of Scivis. Notice that some of the threads (0-3) are performing system functions for the JVM while others (4, 5, and 9) are performing user tasks. As before, it is a simple matter of loading a different measurement library to capture a performance trace instead of statistical profiles.

Figure: TAU profiles the multi-threaded Java visualization application
using JVMPI