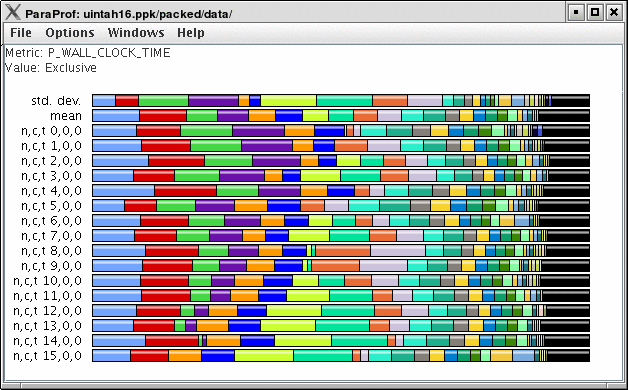
Upon loading a profile, or double-clicking on a metric, the Main Data Window will be displayed.
This window shows each thread as well as statistics as a combined bar graph. Each function is represented by a different color (though possibly cycled). From anywhere in ParaProf, you can right-click on objects representing threads or functions to launch displays associated with those objects. For example, in Figure 9.4, “Main Data Window”, right click on the text n,c,t, 8,0,0 to launch thread based displays for node 8.
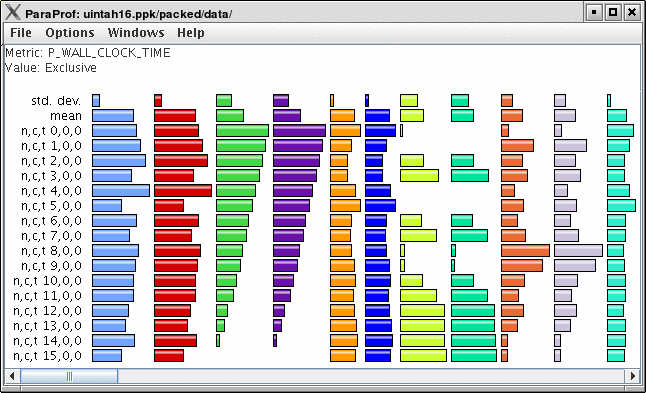
You may also turn off the stacking of bars so that individual functions can be compared across threads in a global display.

