Table of Contents
ParaProf displays massive parallel profiles through the use of OpenGL hardware acceleration through the 3D Visualization window. Each window is fully configurable with rotation, translation, and zooming capabilities. Rotation is accomplished by holding the left mouse button down and dragging the mouse. Translation is done likewise with the right mouse button. Zooming is done with the mousewheel and the + and - keyboard buttons.
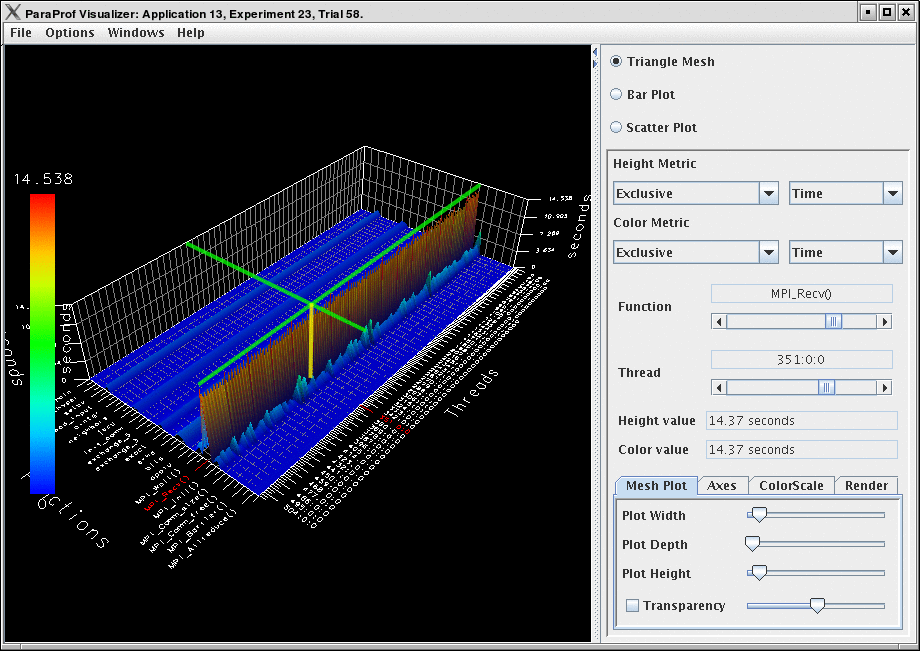
This visualization method shows two metrics for all functions, all threads. The height represents one chosen metric, and the color, another. These are selected from the drop-down boxes on the right.
To pinpoint a specific value in the plot, move the
Function and Thread sliders to
cycle through the available functions/threads. The values for the two
metrics, in this case for MPI_Recv() on
Node 351, the value is 14.37
seconds.