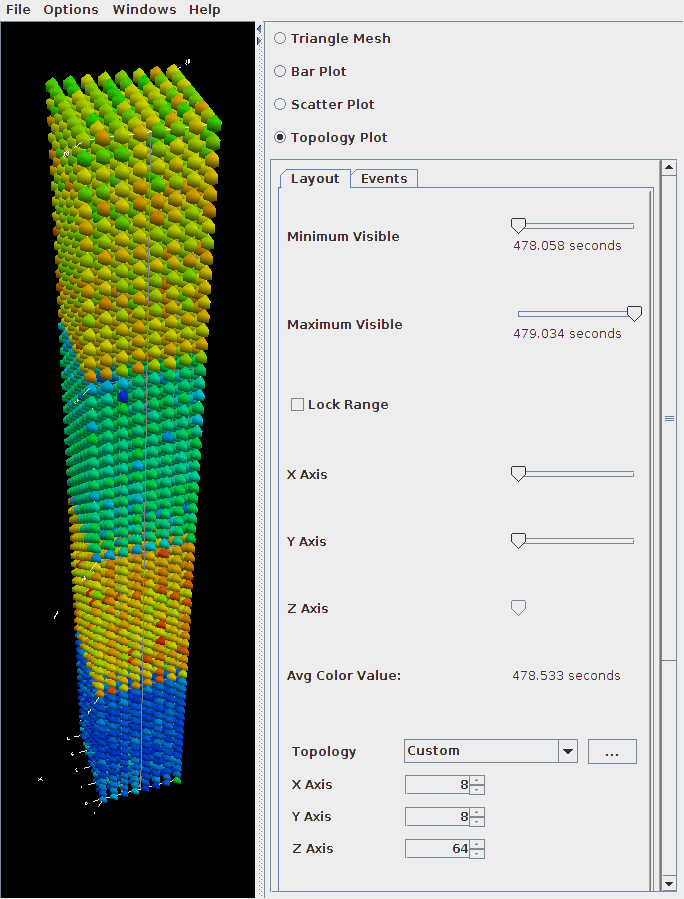
In this visualization, you can either define the layout with a MESP topology definition file or you can fill a rectangular prism of user-defined volume with rank-points in order of rank. For more information, please see the etc/topology directory for additional details on MESP topology definitions.
If the loaded profile is a cube file or a profile from a BGB, then this visualizations groups the threads in two or three dimensional space using topology information supplied by the profile.
When topology metadata is available a trial-specific topological layout may be visualized by selecting Windows->gt;3D Visualization and selecting Topology Plot on the visualization pane.
The layout tab allows control of the layout and display of visualized cores/processes.
Minimum/Maximum Visible (restricts display of nodes with measured values above/below the selected levels). Lock Range causes the sliders to move in unison.
The X/Y/Z Axis sliders allow selection of planes, lines and individual points in the topology for examination of specific values in the display, listed in the Avg. Color Value field.
The topology selection dropdown box allows selection of either trial-specific topologies contained in the metadata, mapped topologies stored in an external file or a custom topology defined by the size of the prism containing the visualized cores. The ... button allows selection of a custom topology mapping file while the map button allows selection of a map file (see <tau2>/etc/topology/README.cray_map for more information on generating map files).
If a Custom is selected the dimensions of the rectangular prism containing the cores are defined by the X/Y/Z axis control widgets.
The Events tab controls which events are used to define the color values and positions of cores/processes in the display. For trail-specific and Custom topologies only event3(Color) can be changed. For topologies loaded in MESP definition files all four events may be used in calculation of the topology layout. In either case, interval, atomic or metadata values may be used to color or position points in the display.
