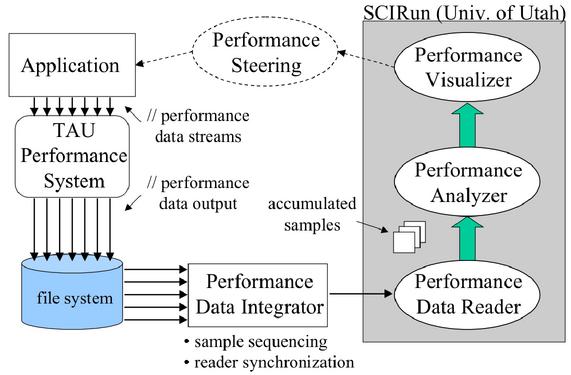
Our prototype is based on the TAU performance system, the Uintah
computational framework [15], and the SCIRun [13]
computational steering and visualization system. Parallel profile
data from a Uintah simulation are sampled and written to profile files
during execution. The performance data integrator reads the
performance profile files, generated for each profile sample for each
thread, and merges the files into a single, synchronized profile
sample dataset. Each profile sample file is assigned a sequence
number and the whole dataset is sequenced and timestamped. A socket-
based protocol is maintained with the performance data reader to
inform it of the availability of new profile samples and to coordinate
dataset transfer.
The performance profile reader, implemented as a SCIRun module, inputs
the merged profile sample dataset sent by the data integrator and
stores the dataset in an internal C++ object structure. A profile
sample dataset is organized in a tree-like manner according to TAU
profile hierarchy:
node ![]() context
context ![]() thread
thread ![]() profile data
profile data
Each object in the profile tree has a set of attribute access methods
and a set of offspring access methods.
Using the access methods on the profile tree object, all performance
profile data, including cross-sample data, is available for analysis.
Utah's SCIRun [13] provides a programmable system for
building and linking the analysis and visualization components. A
library of performance analysis modules can be developed, some simple
and others more sophisticated. We have implemented two generic
profile analysis modules: Gen2DField and Gen3DField. The
modules provide user control that allows them to be customized with
respect to events, data values, number of samples, and filter options.
Ultimately, the output of the analysis modules must be in a form that
can be visualized. The Gen2DField and Gen3DField modules
are so named because they produce 2D and 3D Field data,
respectively. SCIRun has different geometric meshes available for
Fields. We use an ImageMesh for 2D fields and a
PointCloudMesh for 3D fields.
The role of the performance visualizer component is to read the Field
objects generated from performance analysis and show graphical
representations of performance results. We have built three
visualization modules to demonstrate the display of 2D and 3D data
fields. The Terrain visualizer shows ImageMesh data as a
surface. The user can select the resolution of the X and Y dimensions
in the Terrain control panel. A TerrainDenotator module was
developed to mark interesting points in the visualization. A
different display of 2D field data is produced by the KiviatTube
visualizer. Here a ``tube'' surface is created where the distance of
points from the tube center axis is determined by metric values and
the tube length correlates with the sample. The visualization of
PointCloudMesh data is accomplished by the PointCloud visualizer
module.
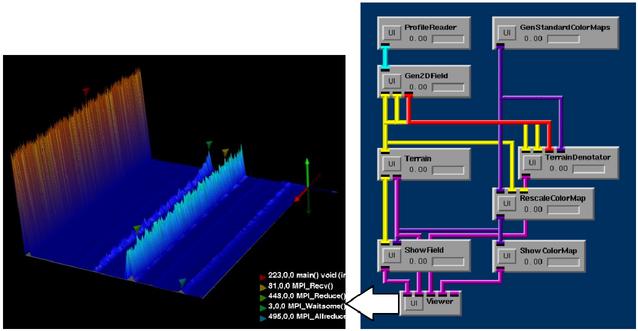
The SCIRun program graph in Figure 4 shows how the data reader,
analyzer, and visualizer modules are connected to process parallel
profile samples from a Uintah application. The visualization is for a
500 processor run and shows the entire parallel profile measurement.
The performance events are along the left-right axis, the processors
along the in-out axis, and the performance metric (in this case, the
exclusive execution time) along the up-down axis. Denotators are used
to identify the performance events in the legend with the largest
metric values. This full performance view enables the user to quickly
identify major performance contributors.