![[Previous]](/~hacks/decor/arrow-left.gif)
![[Top]](/~hacks/decor/arrow-top.gif)
![[Next]](/~hacks/decor/arrow-right.gif)
Introduction
The goal of this case study is to demonstrate how this new performance visualization paradigm can assist programmers requiring evaluations of data distributions. The work by Kondapaneni, Pancake, and Ward [20] demonstrates how data distributions and alignments in Fortran D (a language which contributed significantly to the design of HPF) may be specified using graphical representations of program data structures. They claim that the accuracy of data distributions specified by programmers using their visual programming tool were more accurate than those made by programmers who did not use the tool. Furthermore, the graphical environment encouraged experimentation with different mappings. These results strongly suggest that the evaluation of data distributions could benefit from graphical representations as well. To this end, the development of an experimental data distribution visualization (DDV) environment - a framework from which visualization techniques and evaluation criteria can arise - will be explored.
The rest of this case study will proceed as follows. First, a brief overview of the DDV project will be followed by a summary of the relevant aspects of High Performance Fortran. A particular application will be explored, and then some observations on the value of the visualizations which were generated will be discussed. Finally, some possible areas for future work and a summary will be given.
First, metrics that will help the programmer determine the effectiveness of a given data distribution must be identified. Once this occurs, visualizations showing some or all of those metrics for a given distribution can be developed. Second, these visualizations should demonstrate some consistency with the programmer's mental model of the data structure, the distribution, or other aspects of the problem. This is a critical goal which deserves further explanation.
One of the primary features of HPF is that it offers an abstraction far removed from any particular architecture. Thus, the specific architectural knowledge required by the HPF programmer is far less than that required for other parallel environments. The consequence of this is that traditional performance visualizations based on physical processors and low-level message passing, for example, may not be as meaningful to the HPF programmer. Thus, visualizations for HPF must demonstrate levels of abstraction that are consistent with the language's - and hopefully the programmer's - underlying conceptual model.
HPF is a set of extensions and modifications to Fortran 90 [15] to offer data parallelism in the form of explicit parallel loop constructs, code tuning for various parallel architectures through a set of extrinsic procedures, and high performance on MIMD and SIMD machines through data distribution and alignment capabilities which the user specifies with compiler directives.
Goals for a DDV Environment
High Performance Fortran
The Programming Model
| HPF Directive | Function |
|---|---|
| PROCESSORS | Declare an n-dimensional mesh of virtual processors |
| ALIGN | Specify relationships between multiple arrays |
| DISTRIBUTE | Specify how arrays (or groups of arrays) are distributed across virtual processors |
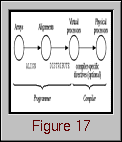
Figure 16. The primary compiler directives in HPF allow users to create virtual processors, align data structures, and distribute data across virtual processors.The PROCESSORS directive allows the user to declare an abstract set of processors onto which distributed arrays are mapped. The abstract processor set takes the form of an n-dimensional mesh with no inherent interconnection network. Next, relationships between different data structures are specified with the ALIGN directive. An ALIGNment offers a common structure to which several arrays are oriented. Finally, using the DISTRIBUTE directive, ALIGNments (i.e., groups of related arrays) are mapped onto the abstract set of processors. Thus, the HPF programming model can be illustrated as in Figure 17 [11].

Figure 17. In HPF, programmers specify how data structures are distributed across a set of virtual processors, but the compiler is responsible for mapping virtual processors to the physical processing units of the computer.From the programmer's perspective, this is a two-level mapping: first, data structures are aligned with one another, and then these groups of data structures are distributed onto a set of abstract processors. The compiler takes responsibility for mapping the abstract processor set onto the physical processors. (The HPF Forum suggests that commercial HPF compilers may wish to offer compiler-specific directives so that the user has some say in how abstract processors are mapped to physical processors.) From this, the underlying programming model becomes evident. Programs are written as if running on an arbitrarily sized, n-dimensional mesh of processors. This is consistent with the ideal data-parallel programming paradigm where the amount and type of data determines the processing resources needed.
The HPF model is dependent on two assumptions that are reasonable for current architectures. First, an operation involving multiple data elements will be faster if the elements are all on the same processor. Second, many such operations can be done simultaneously if they can be performed on different processors.
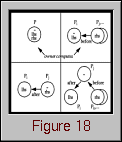
Figure 18. On a distributed-memory parallel computer, an assignment statement can be carried out using four techniques.Pi denotes processor i. The processor containing "lhs" owns the data element on the left-hand side of the assignment; the processor(s) with "rhs" owns data elements which are required by the computation; the processor containing the "=" is the processor which performs the computation. Annotated arrows indicate the interprocessor communication required with respect to when the computation is performed (i.e., before or after).
Given a data distribution, the processor responsible for performing a computation is not specified by HPF; that is, it is up to the compiler to determine which processor will perform a given computation. As noted in Figure 18, one of the more popular parallel computation models is known as owner computes. Under this scheme, the processor which "owns" the left-hand side data element (i.e., the data element to which the assignment is being made) is the one that performs the computation. Thus, before the computation can occur, all data elements which occur on the right-hand side of the assignment and reside on remote processors must be copied into the owner processor. A degenerate case of owner computes occurs when all data elements are locally owned. Thus, the top half of Figure 18 illustrates cases of the owner computes rule.
Since the manner in which assignments and computations are carried out is compiler-dependent, this work will generally assume that the owner computes rule is used. This assumption is evident only in the sample application described later.
Establishing the DDV Problem Domain
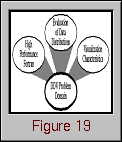
Figure 19. The DDV problem consists of three main issues.
In addition, data structure alignments are not considered. The current visualization system considers only individual arrays. Thus, relationships to other arrays, specified with the ALIGN directive, are currently irrelevant, though such relationships could undoubtedly play a role in future performance visualizations.
In HPF, programmers can dynamically redistribute arrays in the middle of their program. To maintain simplicity, DDV considers static distributions only.
Finally, as mentioned earlier, the owner computes rule will be assumed as the computational model for the sample application.
Thus, it stands to reason that the type of accesses being made to data structures (i.e., reads or writes) and the type of communication associated with that operation (i.e., local or remote) will play an important role in determining whether a given distribution is good or bad. If visualizations can be devised that show reference patterns for both the data structure and the processors across which the data is distributed, then the HPF programmer can answer the questions above. To this end, DDV focuses on collecting information about data reference patterns, and then determines which processor has a given data element under the specified data distribution. Note that "processor," unless otherwise stated, refers to "virtual" processor during the rest of this chapter. Since HPF will potentially run on many different architectures, visualizations based on virtual processors are not architecture-specific.
In order to answer fully the questions posed above, visualizations should incorporate the passage of time. In general, this means that there should be some component of animation in the visualizations. (Although, time can be incorporated into visualizations in other ways, as was done in Chapter VII.)
Finally, the ability to show multiple dimensions of the problem in a single visualization may be useful in some circumstances. At the very least, this should be an option for the programmer.
Given the establishment of the DDV problem domain, the problem at hand is well-defined and approachable. We now turn to a discussion of the experimental environment which was developed within the parallel program and performance visualization methodology that is the topic of this thesis.
An Experimental DDV Environment
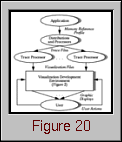
Figure 20. The DDV environment incorporates the implementation environment of Figure 2 by adding capabilities for collecting and processing trace and performance data.
While the profile may not actually represent the parallel execution, it identifies the reference patterns that an application exhibits. Better yet, the reference profile is independent of any particular data distribution. Thus, a single profile can lead to the creation of any number of trace files which are distribution-specific. If a real parallel application was to be used, then the TRACE function could be easily modified to generate distribution-specific information, and the memory reference profile would be unnecessary.
The TRACE function accepts a time stamp, the location of the "owner" element, a range of referenced data elements, and the operation (read or write) performed. (Note that whether the operation required local or remote communication is unknown until a distribution is specified in later steps.)
First, define c(j,k), the ceiling division function, by c(j,k) = FLOOR((j+k-1)/k). Let d represent the size of the data array in a certain dimension, r, and let p be the size of the corresponding dimension in the processor array. (Assume all dimensions have a lower bound of 1.) Then, the specification BLOCK(m) means that data element j of dimension r will be mapped to the abstract processor at location c(j,m), provided that mp >= d. Similarly, CYCLIC(m) means that the data element in location j of dimension r will be owned by processor 1+((c(j,m)-1) MOD p). These relationships are used to transform a memory reference profile into a trace file once a data distribution has been specified. The trace file allows for multiple operations in a given time step. In this fashion, the annotation of a sequential application can be used to mimic the operation of the parallel application.
The visualizations display two views (cumulative and average) of a given trace quantity. One statistic is mapped to a colored background on the grid, and the other is mapped to "glyphs" which float in front of the grid. (The graphic displays will be discussed in more detail later.) The user can control several aspects of the display:
The user can also control the animation with the "Sequence Control" box. The controls are simple and intuitive, similar to those used in audio cassette and compact disc players.
In the actual visualizations, quantities are represented by the size and color of the glyphs, and by the color of the background grid coloring. (Note that glyphs contain redundant information. That is, the size and color of the glyph represent the same quantity.)
Let us consider the distribution of data which results from the distribution and processor arrangement given above. Figure 21 specifies the processor which owns each element of the 10x10 array by assigning each processor a unique number. It is important to note that processors 0, 1, 8, and 9 own many more elements than the other processors because columns are distributed in a cyclic manner.
Application: Gaussian Elimination
The Data Distribution
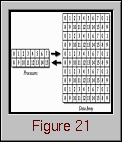
Figure 21. The cyclic distribution of a 10x10 array onto a 2x8 grid of processors leaves some processors more heavily loaded with data elements.
Source Code Instrumentation
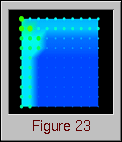
Figure 23 illustrates the data array early in the execution of the Gaussian elimination algorithm (time 20). The background represents the average number of memory references, while the glyphs (size and color) keep track of the cumulative number of references. With element (0,0) in the upper left corner, the access patterns of this phase of the algorithm are already evident. As the algorithm proceeds, the glyphs in each column below the main diagonal grow larger (and change color) as the column elements below the diagonal are zeroed-out, and the row elements are adjusted accordingly.
c = 1.0/B[j][j];
  for (col=0; col<MAX; col++) {
    /* scalar mult. the elements of row */
    B[j][col] = c*B[j][col];

    /* each owner read a copy of B[j,j] */
    TRACE(Time, j,col, j,j, j,j, 0);
    /* read own copy of B[j,col] */
    TRACE(Time, j,col, j,j, col,col, 0);
    /* write B[j,col] */
    TRACE(Time, j,col, j,j, col,col, 1);

    /* do the same to the augmentation */
    M[j][col] = c*M[j][col];
  }
Time++;
Figure 22. An instrumented code fragment shows how the sequential algorithm is used to imitate a possible parallel implementation.
The piece of code illustrates the transformation that takes place during the instrumentation process. The loop is one part of the Gaussian elimination algorithm. In this example, each row is being scaled by the reciprocal of the element on the main diagonal. While the sequential algorithm makes an assignment to the variable c, the calls to TRACE mimic what might actually happen in a parallel version of the algorithm by having each of the "owners" - referenced by the data element at (j,col) - request copies of that value. Note also that the Time variable is not incremented until after the loop, suggesting that the operations in the for-loop could be done simultaneously in a parallel implementation.Display Generation
Visualizations
Animation (277K)
Figure 23. (Time 20) Data access patterns are already evident early in the algorithm.
Figure 24 displays the state of the processors at the same time as Figure 23. It can be seen that the size of the glyphs on the left side of the grid are slightly larger than the others, however, it is too early to tell if this is due to a poor distribution or the particular phase of the algorithm.
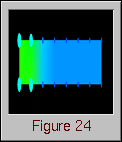
Figure 24. (Time 20) The processors do not yet appear too unbalanced.Figure 25 shows the data array at time 60 of the algorithm. The first phase of the Gaussian elimination has been completed, and the second phase is just beginning. Thus, all of the elements on the main diagonal are now 1, and all elements below the diagonal are 0. The algorithm is proceeding to zero-out all matrix elements above the main diagonal by working its way back through the columns in reverse order, toward the origin of the array. Figure 26 shows a different quantity being displayed on the data array. Rather than showing all memory references, Figure 26 shows only remote writes, the pattern of which is considerably different than the overall memory reference pattern illustrated by Figure 25.
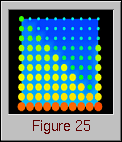
Figure 25. (Time 60) The visualization reflects the beginning of the second phase of the Gaussian Elimination algorithm.
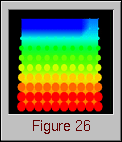
Figure 26. (Time 60) The distribution of remote writes is considerably different than the overall distribution of all memory accesses.Figure 27 again shows the status of the processor grid. The imbalance generated by the cyclic distribution is becoming more and more evident at this point in the animation. The other processors appear to be fairly well-balanced, though.
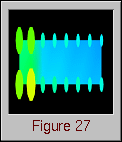
Figure 27. (Time 60) A growing imbalance in processor load becomes evident.By time 89, as seen in Figure 28, the algorithm is nearing completion with only two columns remaining to be processed. It is evident from this display that overall, the Gaussian elimination algorithm accesses the array in a fairly uniform manner. That is, there are no elements that receive excessive attention in the long run. However, the earlier frames of the animation clearly show that the algorithm progressed in certain phases.
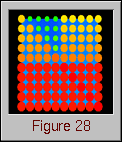
Figure 28. (Time 89) The algorithm nears completion, and the display seems to suggest a fairly uniform access pattern over the life of the algorithm.Finally, Figure 29 illustrates the sorry state of the processor grid by the end of the algorithm. The load imbalance introduced by the cyclic distribution has clearly overtaxed the processors in the two left columns of the grid.
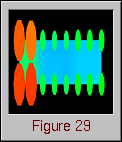
Figure 29. (Time 89) Processors in the left two columns of the grid have experienced significantly more memory accesses than the others.Some conclusions regarding the effectiveness of a cyclic distribution in this case have already been made. Using what has been learned and the DDV tools discussed earlier, the programmer could now go back and create a new trace file using a different distribution or a different processor arrangement. In this way, experimenting with different distributions is simplified and the programmer undoubtedly gains insight not only to the algorithm, but to which distributions are most effective for it.
While reference patterns can be extracted directly from the animated displays, the size of messages being passed between processors remains obscured. Similarly, contention for data elements can not be seen. While this study has not focused on these metrics, they are still of potential interest to programmers.
It was mentioned earlier that the glyphs contain redundant information by having the size and color controlled by the same quantity. This could have both positive and negative effects. To novice users, it may reinforce the magnitude of the particular quantity. This technique is called "double cueing." More advanced users might find double cueing redundant and would prefer having color and size each represent a unique metric. The visualization environment is flexible enough to handle both cases.
The background grid coloring represents a more scalable visualization technique, however. By letting the color of the grid at each data element correspond to the quantity being measured, a global picture of memory references can be achieved for both small and large grids. In fact, the display actually seems to improve as the grid grows larger, up to a certain point. By letting the appropriate quantities color the grid background, the "hot" and "cool" spots of the data structure emerge. Also, data visualization software offers zooming capabilities which allow the user to focus on particular regions of the data or processor structure. The issue of scalable visualizations will be explored in detail in the final case study in Chapter IX.
Still other visualizations may choose to deviate from the consistency goal to reveal relationships that are not evident in a simple two-dimensional grid. It is still important that the programmer have access to displays like the ones presented here, but there could be much to gain from advanced displays which are not necessarily formulated from a programmer's conceptual view. Such extensions to data distribution displays are pursued in Chapter IX which deals with scalable performance visualizations for data-parallel programs in general.
The important role played by data distributions in determining the efficiency of parallel applications demands that tools which assist in evaluating data distributions be developed. This case study has developed an experimental environment that explores the use of visualization for the evaluation of data distributions. It has been demonstrated that visualization techniques can be developed that will benefit the programmer responsible for writing efficient HPF programs.
Observations
Usefulness
Understandability
Scalability
Summary
Last modified: Wed Jan 20 15:14:29 PST 1999
Steven Hackstadt /
hacks@cs.uoregon.edu