Table of Contents
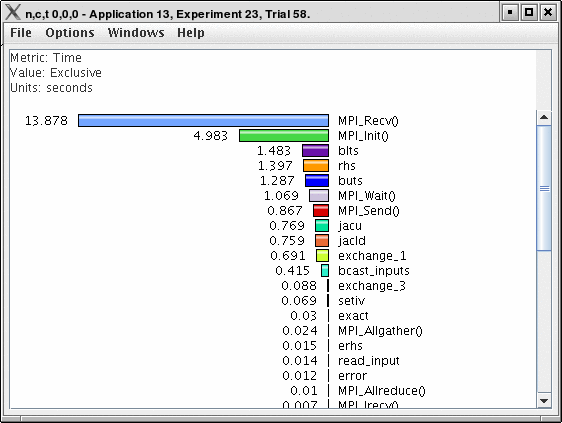
ParaProf displays several windows that show data for one thread of execution. In addition to per thread values, the users may also select mean or standard deviation as the "thread" to display. In this mode, the mean or standard deviation of the values across the threads will be used as the value.
